Health Status
Identifying health challenges and developing targeted interventions to improve community health outcomes is crucial. Health status, which measures a community’s overall well-being, includes various indicators of physical and mental health. Key factors are the rate of natural increase, Prescription Drug Monitoring Program (PDMP) prescription rates, child and teen checkups, prenatal care, and child immunizations.
- Rate of natural increase: Reflects population growth and healthcare needs.
- PDMP prescription rates: helps identify misuse, monitor prescribing, and ensure safe medication use.
- Child and teen checkups: Essential for early detection and prevention of health issues.
- Prenatal care: Crucial for reducing pregnancy and childbirth complications.
- Child immunizations: Vital for preventing infectious diseases and protecting public health.
General, Physical and Mental Distress
Red Lake County had the highest estimated crude and age-adjusted prevalence rates for fair or poor self-rated health status. Kittson County had the highest estimated crude and age-adjusted prevalence rates for physical distress. Marshall and Pennington counties had the highest estimated crude prevalence rates, while Kittson and Marshall had the highest estimated age-adjusted prevalence rates. However, these rates were not significantly different from the state average or other counties. There were significant differences for Minnesota and all five Quin counties regarding age-adjusted rates for general health and mental distress when compared to physical distress. These were results were significantly higher which suggests that focusing on improving general health and mental well-being in these areas would be beneficial for these communities.
Rate of Natural Increase
The birth rate and death rate are fundamental demographic indicators that provide insights into the population dynamics of a region. The birth rate measures the number of live births per 1,000 people in a given year, while the death rate measures the number of deaths per 1,000 people in the same period. The difference between these two rates is known as the natural increase (or decrease, if deaths exceed births), which indicates the growth or decline of a population excluding migration.
Natural increase is a crucial component of population change, but it does not account for the movement of people into or out of a region. Migration can significantly impact population size and composition, often overshadowing natural increase. For instance, a region with a high birth rate and low death rate might still experience population decline if a large number of people move away. Conversely, areas with low natural increase might grow rapidly due to high levels of immigration.
In 2020, four out of the five Quin counties experienced a natural decrease, likely due to the impact of COVID-19. The pandemic significantly influenced both birth and death rates, with increased mortality and potential delays in births due to economic and health uncertainties. Kittson County saw the most notable natural decrease, with a rate of -13.1, the highest among the Quin counties. Roseau County had the second largest natural decrease, with a rate of -3.8, marking a significant shift from previous years. Marshall County and Pennington County both experienced a natural decrease of -1.2, a change from the generally positive natural increase observed in previous years. Red Lake County was the only Quin county to have a natural increase in 2020, with a rate of 3.2, continuing the trend of positive natural increase seen in prior years (Minnesota Department of Health 2015-2020).
Looking ahead,
With the significant impact COVID-19 had on communities and the lag in this data (new data should be available in Q1 2025), it is challenging to predict the lasting effects of the pandemic. It will be crucial to monitor these trends and implement measures to mitigate the long-term impacts. Public health initiatives, economic support, and healthcare improvements could help stabilize and improve the natural increase rates in these counties. Prior to the COVID-19, Kittson County has seen a natural decrease, highlighting the need for targeted public health interventions and policies to support population growth and health in Kittson County.
| Birth Rate | Death Rate | Natural Increase | Year |
|---|---|---|---|
| 8.8 | 12.9 | -4.1 | 2015 |
| 8.1 | 12.9 | -4.8 | 2016 |
| 15.1 | 18.1 | -3.1 | 2017 |
| 12.5 | 13.4 | -0.9 | 2018 |
| 10.5 | 14 | -3.5 | 2019 |
| 7.6 | 20.6 | -13.1 | 2020 |
| Birth Rate | Death Rate | Natural Increase | Year |
|---|---|---|---|
| 13.3 | 9.7 | 3.6 | 2015 |
| 11.4 | 9.7 | 1.7 | 2016 |
| 14 | 8.9 | 5.1 | 2017 |
| 14.5 | 10.5 | 4 | 2018 |
| 8.6 | 8.7 | -0.1 | 2019 |
| 10.4 | 11.6 | -1.2 | 2020 |
| Birth Rate | Death Rate | Natural Increase | Year |
|---|---|---|---|
| 13.3 | 8.7 | 4.6 | 2015 |
| 11.9 | 8.7 | 3.2 | 2016 |
| 11.9 | 9.9 | 2 | 2017 |
| 11.8 | 9.9 | 1.9 | 2018 |
| 10.6 | 10.2 | 0.4 | 2019 |
| 8.9 | 10.1 | -1.2 | 2020 |
| Birth Rate | Death Rate | Natural Increase | Year |
|---|---|---|---|
| 11.6 | 6.2 | 5.4 | 2015 |
| 10.5 | 6.2 | 4.3 | 2016 |
| 10.2 | 7.9 | 2.2 | 2017 |
| 10.8 | 9.8 | 1 | 2018 |
| 11.3 | 8.9 | 2.5 | 2019 |
| 10.9 | 7.7 | 3.2 | 2020 |
| Birth Rate | Death Rate | Natural Increase | Year |
|---|---|---|---|
| 11.6 | 8.8 | 2.9 | 2015 |
| 11.5 | 8.8 | 2.8 | 2016 |
| 11.5 | 9.3 | 2.3 | 2017 |
| 11.4 | 8.3 | 3.1 | 2018 |
| 10.7 | 10 | 0.7 | 2019 |
| 9.1 | 13 | -3.8 | 2020 |
Prescription Rate
Kittson, Marshall, Pennington, Red Lake, and Roseau counties did not experience large changes in prescription rates per 1,000 residents from 2022 to 2023, according to the Minnesota Board of Pharmacy (2022-2023). Prescription rates allow for comparisons between counties. Among the five counties, Marshall County was the only one to see a slight increase in the prescription rate per 1,000 residents during this period.
Several factors can influence changes in prescription rates and why one county may have higher rates than another. These factors include population demographics (such as older populations with higher chronic pain conditions), access to healthcare, variations in healthcare provider prescribing practices, and public health initiatives. A high prescription rate in a county is not necessarily a bad thing; rather, it provides an opportunity to communicate with our local partners to further understand if the prescription rates accurately reflect the needs of the population.
Child and Teen Checkup Outreach
Potential Topic
Prenatal Care
Prenatal care is essential for ensuring the health and well-being of both mothers and their babies. Adequate prenatal care helps to monitor the progress of the pregnancy, identify and manage potential health issues, and provide important health education to expectant mothers.
Data should be available in Q1 2025 (The Annie E. Casey Foundation, KIDS COUNT Data Center 2024).
Ensuring that all expectant mothers receive timely and adequate prenatal care is crucial for the health of both mothers and their babies. Continued efforts to improve access to and the quality of prenatal care will help further reduce these rates and improve health outcomes across our communities.
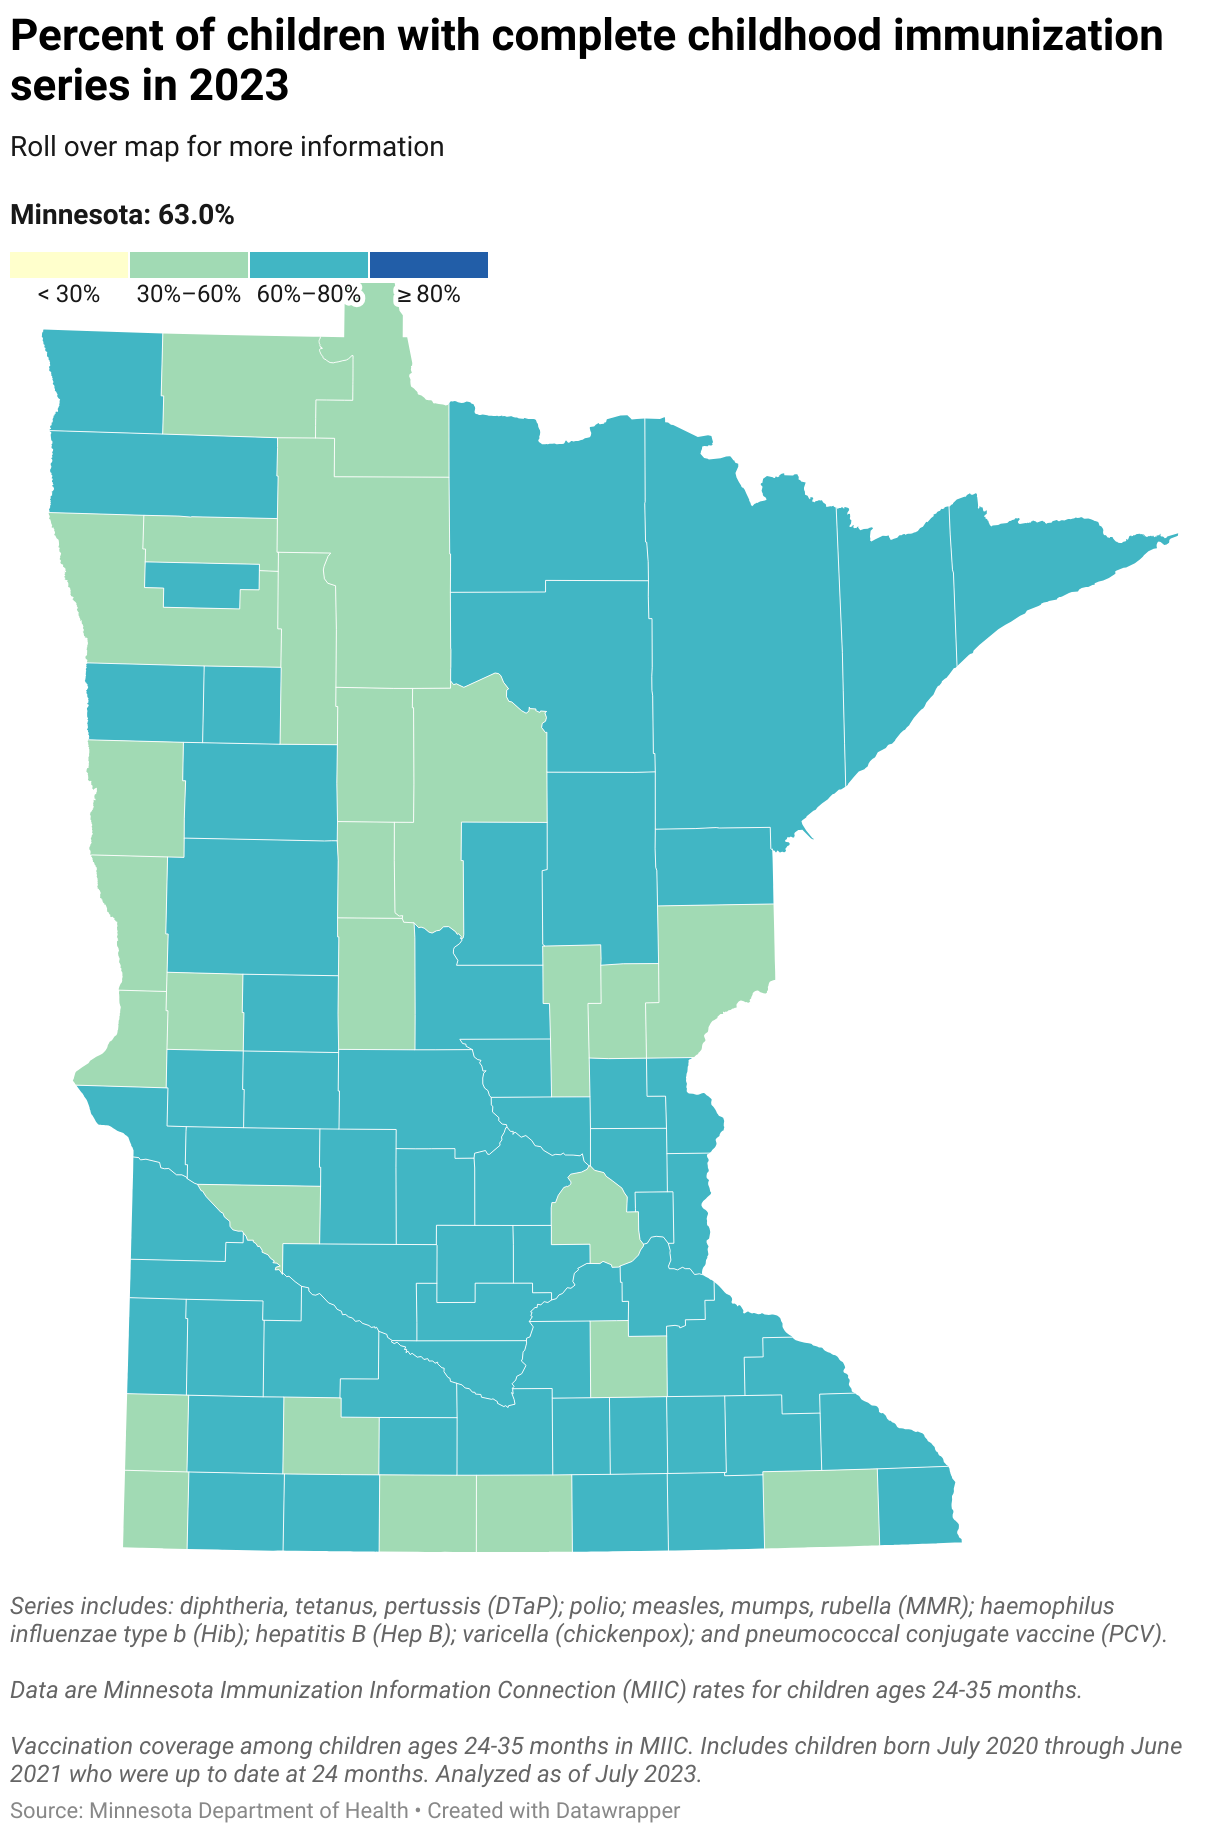
Childhood Immunizations
Teaching people about the importance of vaccines, sending vaccination reminders, and making it easier to get vaccines can help increase vaccination rates in children, adolescents, and adults. According to Minnesota Department of Health, childhood and adolescent vaccination rates decreased during the COVID-19 pandemic and a Healthy People (HP) 2030 goal is to increase vaccination rates. Infants and children need to get vaccinated to prevent diseases like hepatitis, measles, and pertussis.
Kittson County: In 2023, Kittson County had higher immunization rates than the Minnesota state averages for DTaP, Hep A, Hep B, Hib, MMR, PCV, Polio, Rotavirus, and Varicella. The county saw improvements across all vaccines, with the highest increases in DTaP (+10.10%), MMR (+10.40%), and PCV (+15.10%).
Marshall County: In 2023, Marshall County had higher immunization rates than the Minnesota state averages for DTaP, Hep A, Hib, MMR, PCV, Polio, Rotavirus, and Varicella. Marshall County was lower for Hep B. The county saw the highest declines in Hep B (-7.20%), MMR (-5.40%), Polio (-5.40%), and Varicella (-6.30%).
Pennington County: In 2023, Pennington County had higher immunization rates than the Minnesota state averages for Hep A, Hep B, MMR, PCV, Polio, Rotavirus, and Varicella. Pennington County was lower for DTaP and Hib. The county saw its largest declines in DTaP (-12.00%), Hep A (-13.50%), and Hib (-7.90%).
Red Lake County: In 2023, Red Lake County had higher immunization rates than the Minnesota state averages for DTaP, Hep B, MMR, PCV, Polio, Rotavirus, and Varicella. Red Lake County was lower for Hep A, and Hib. The county saw an increase in Rotavirus (+8.10%) but experienced the largest declines in DTaP (-13.10%), Hep A (-13.80%), and Hib (-12.70%).
Roseau County: In 2023, Roseau County had higher immunization rate than the Minnesota state average for Hep A. However, Roseau County was not only lower than the state average but also had the lowest immunization rates compared to its Quin partners for DTaP, Hep B, Hib, MMR, PCV, Polio, Rotavirus, and Varicella. The county’s largest declines were for Hib (-6.60%), PCV (-6.30%), and Varicella (-5.60%).