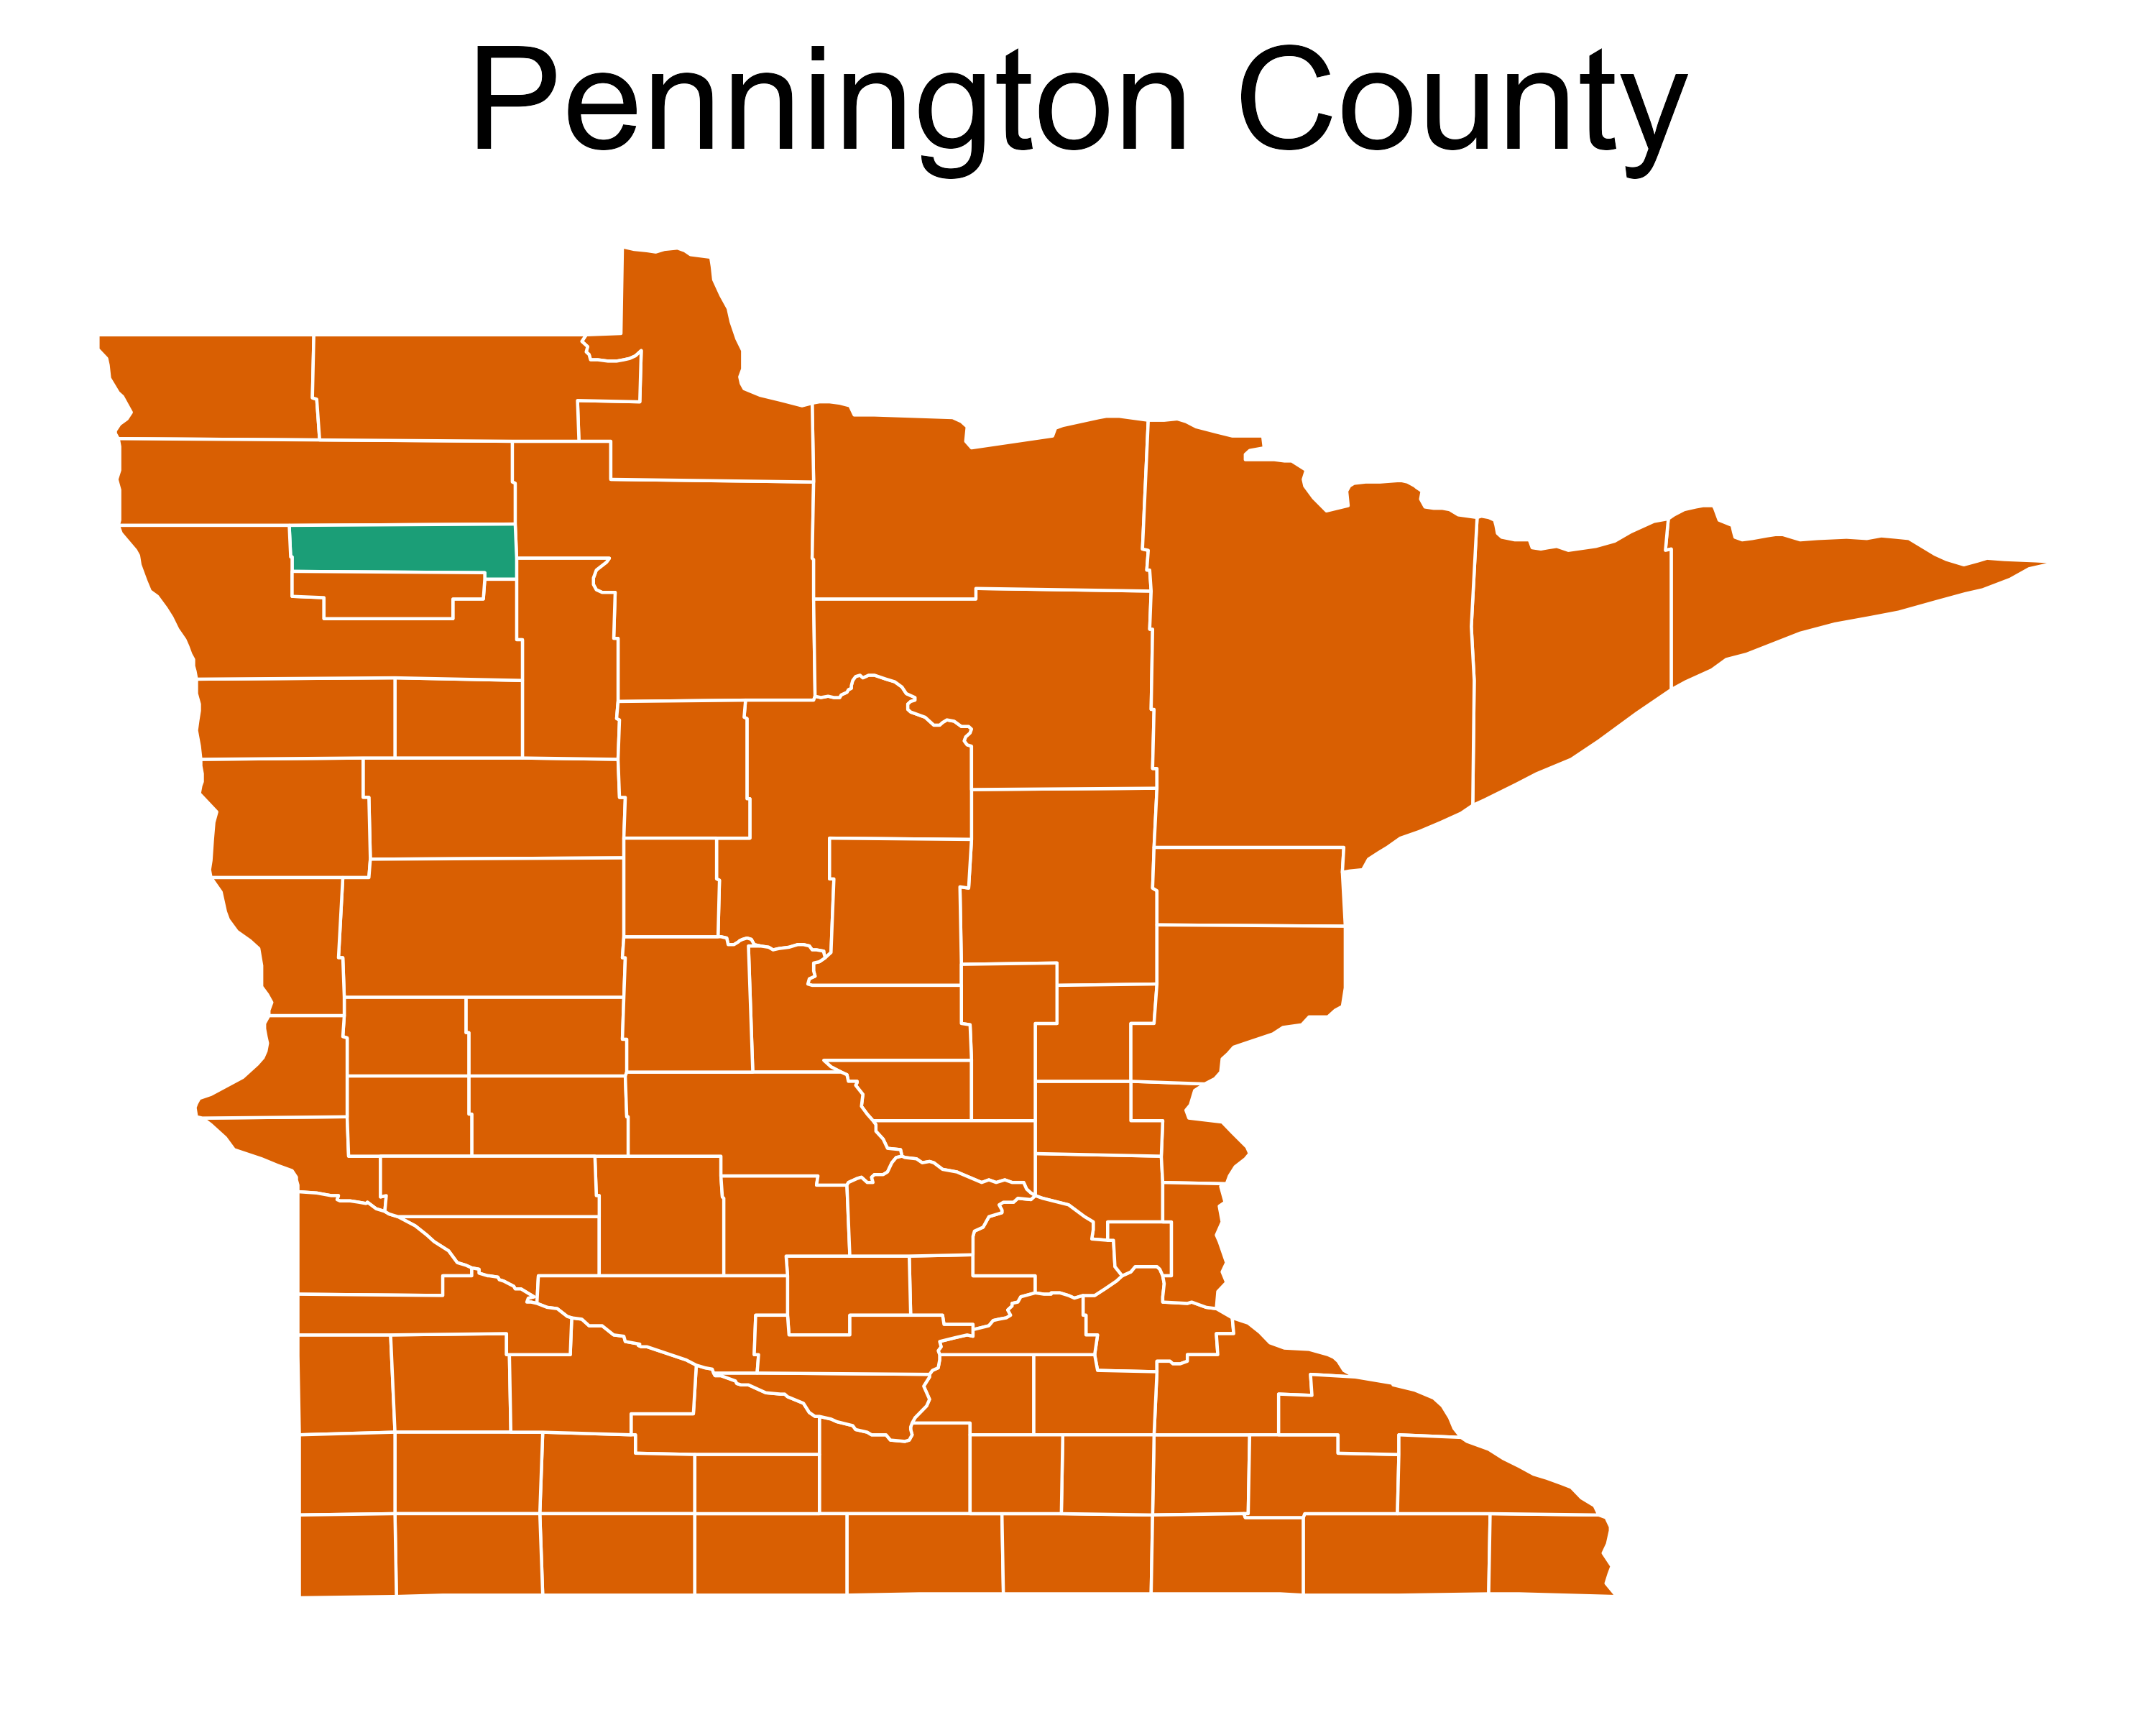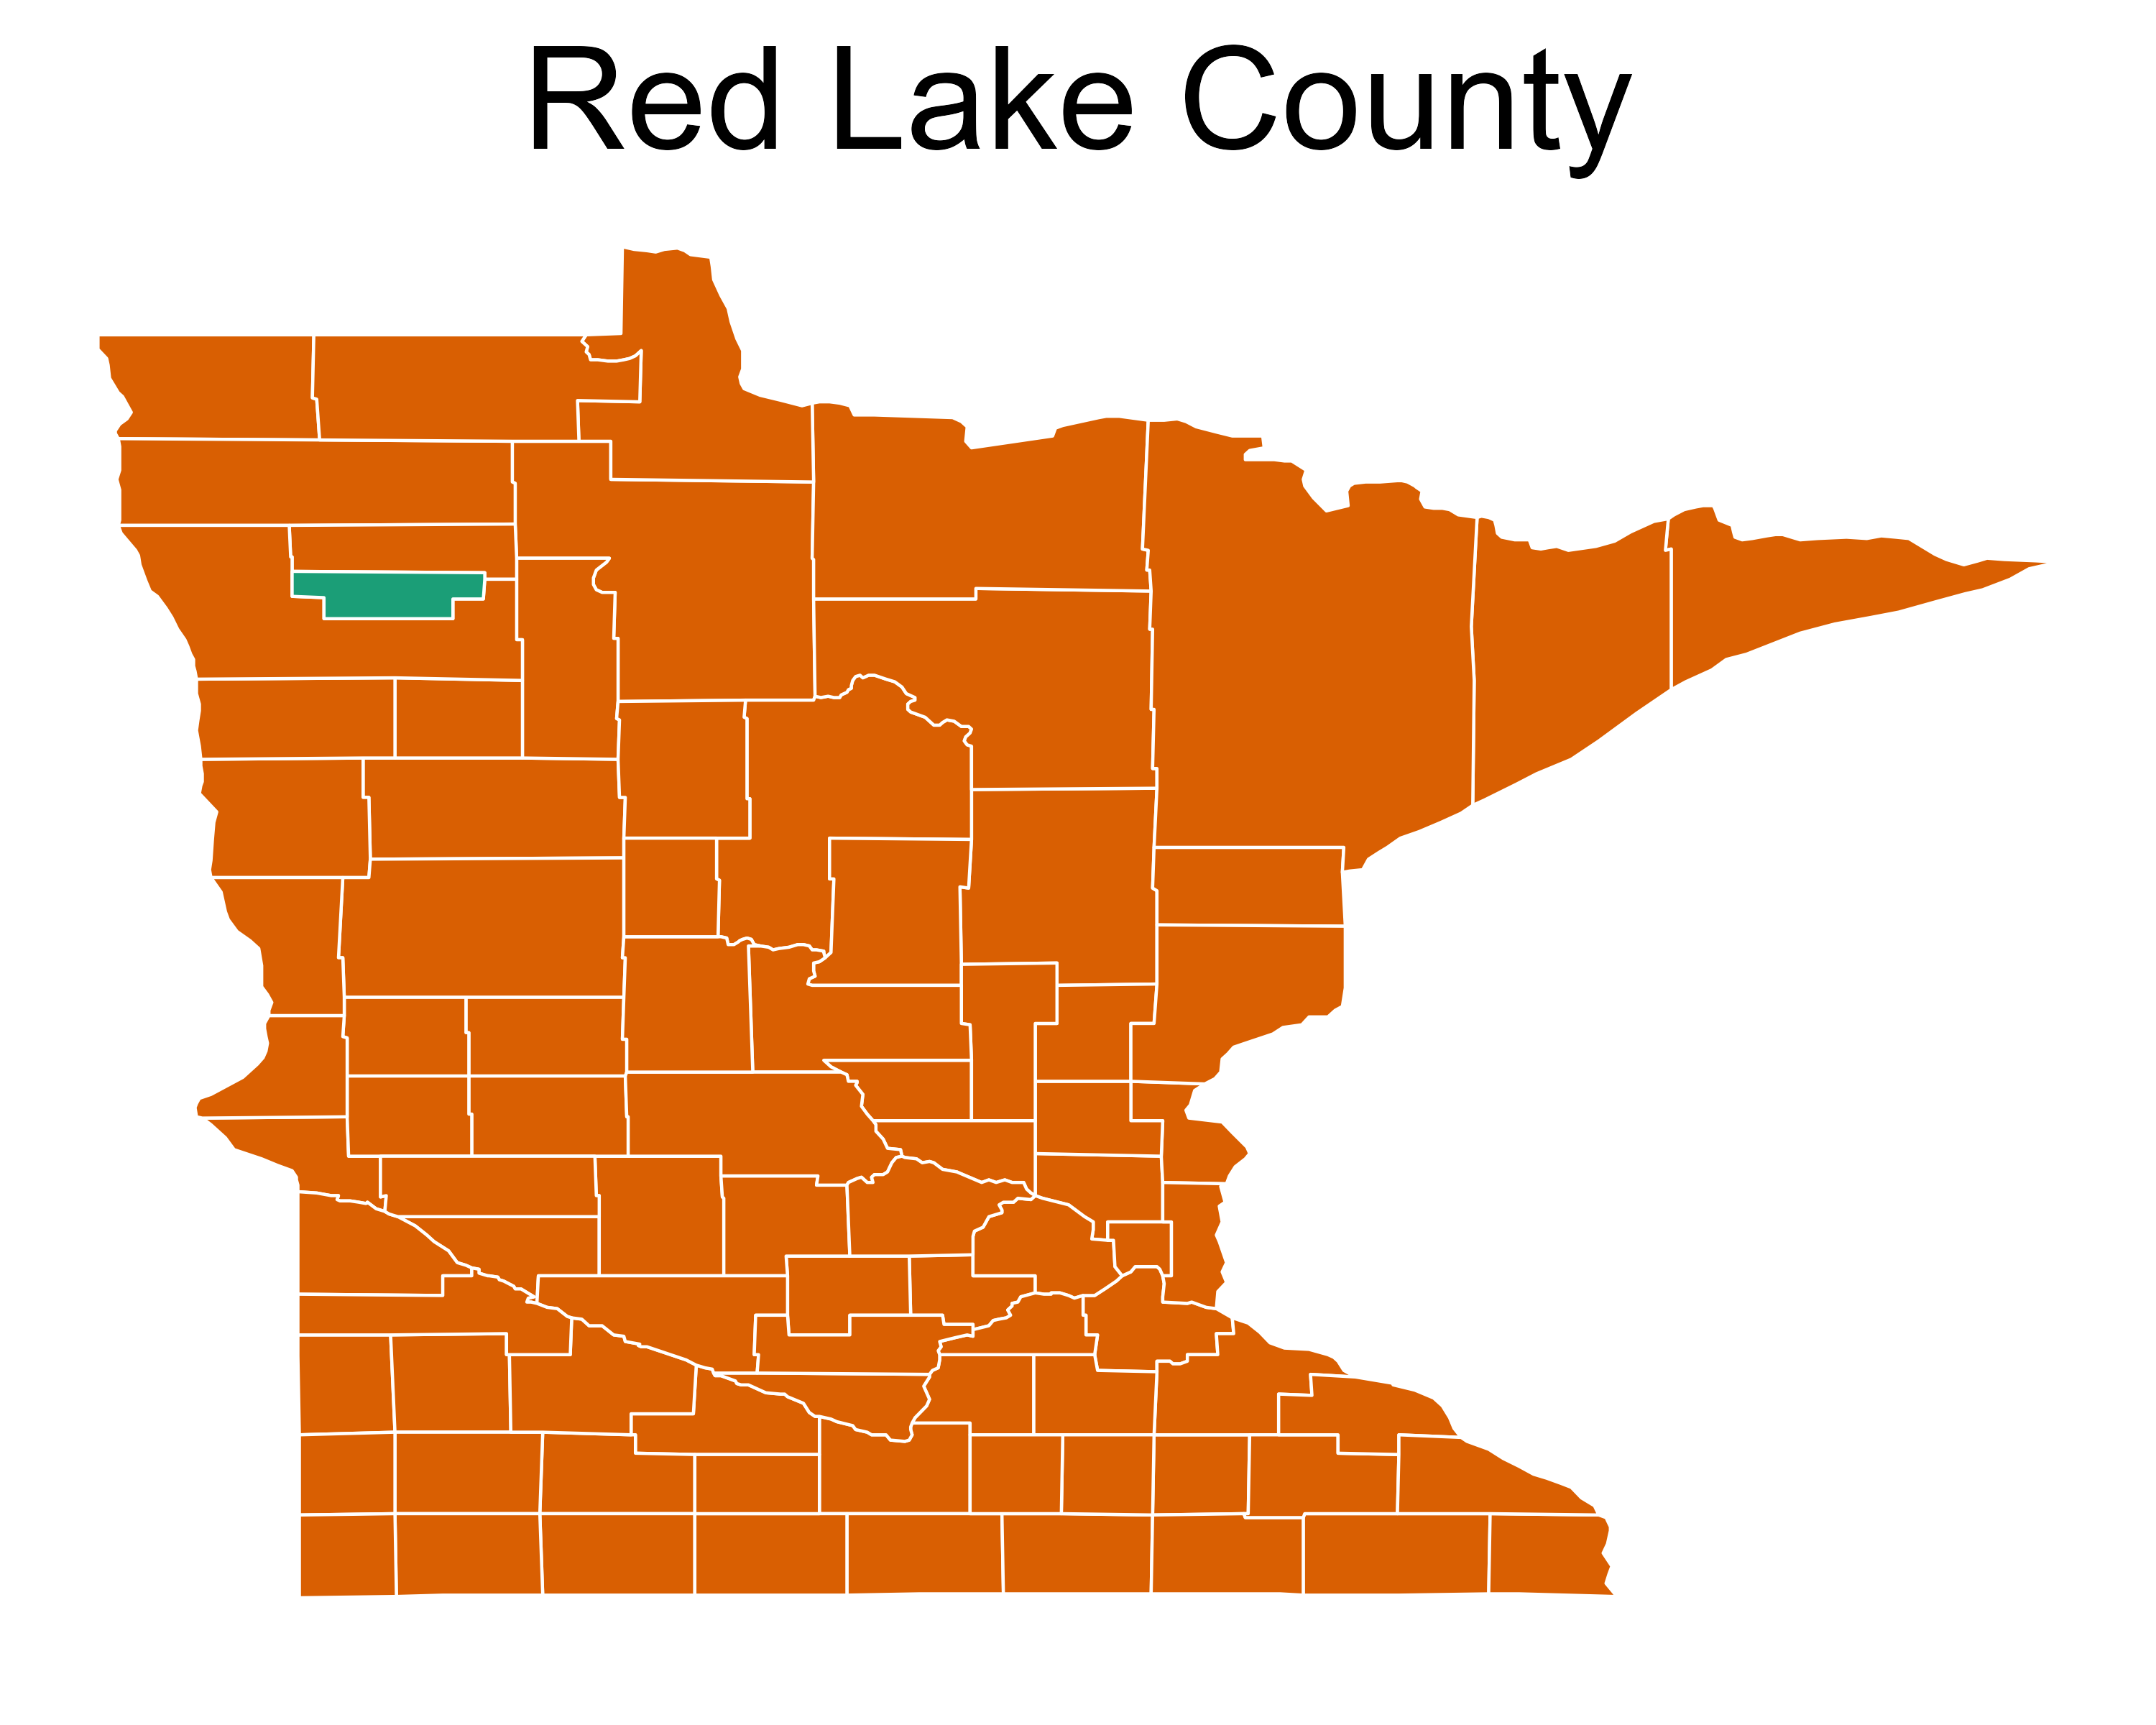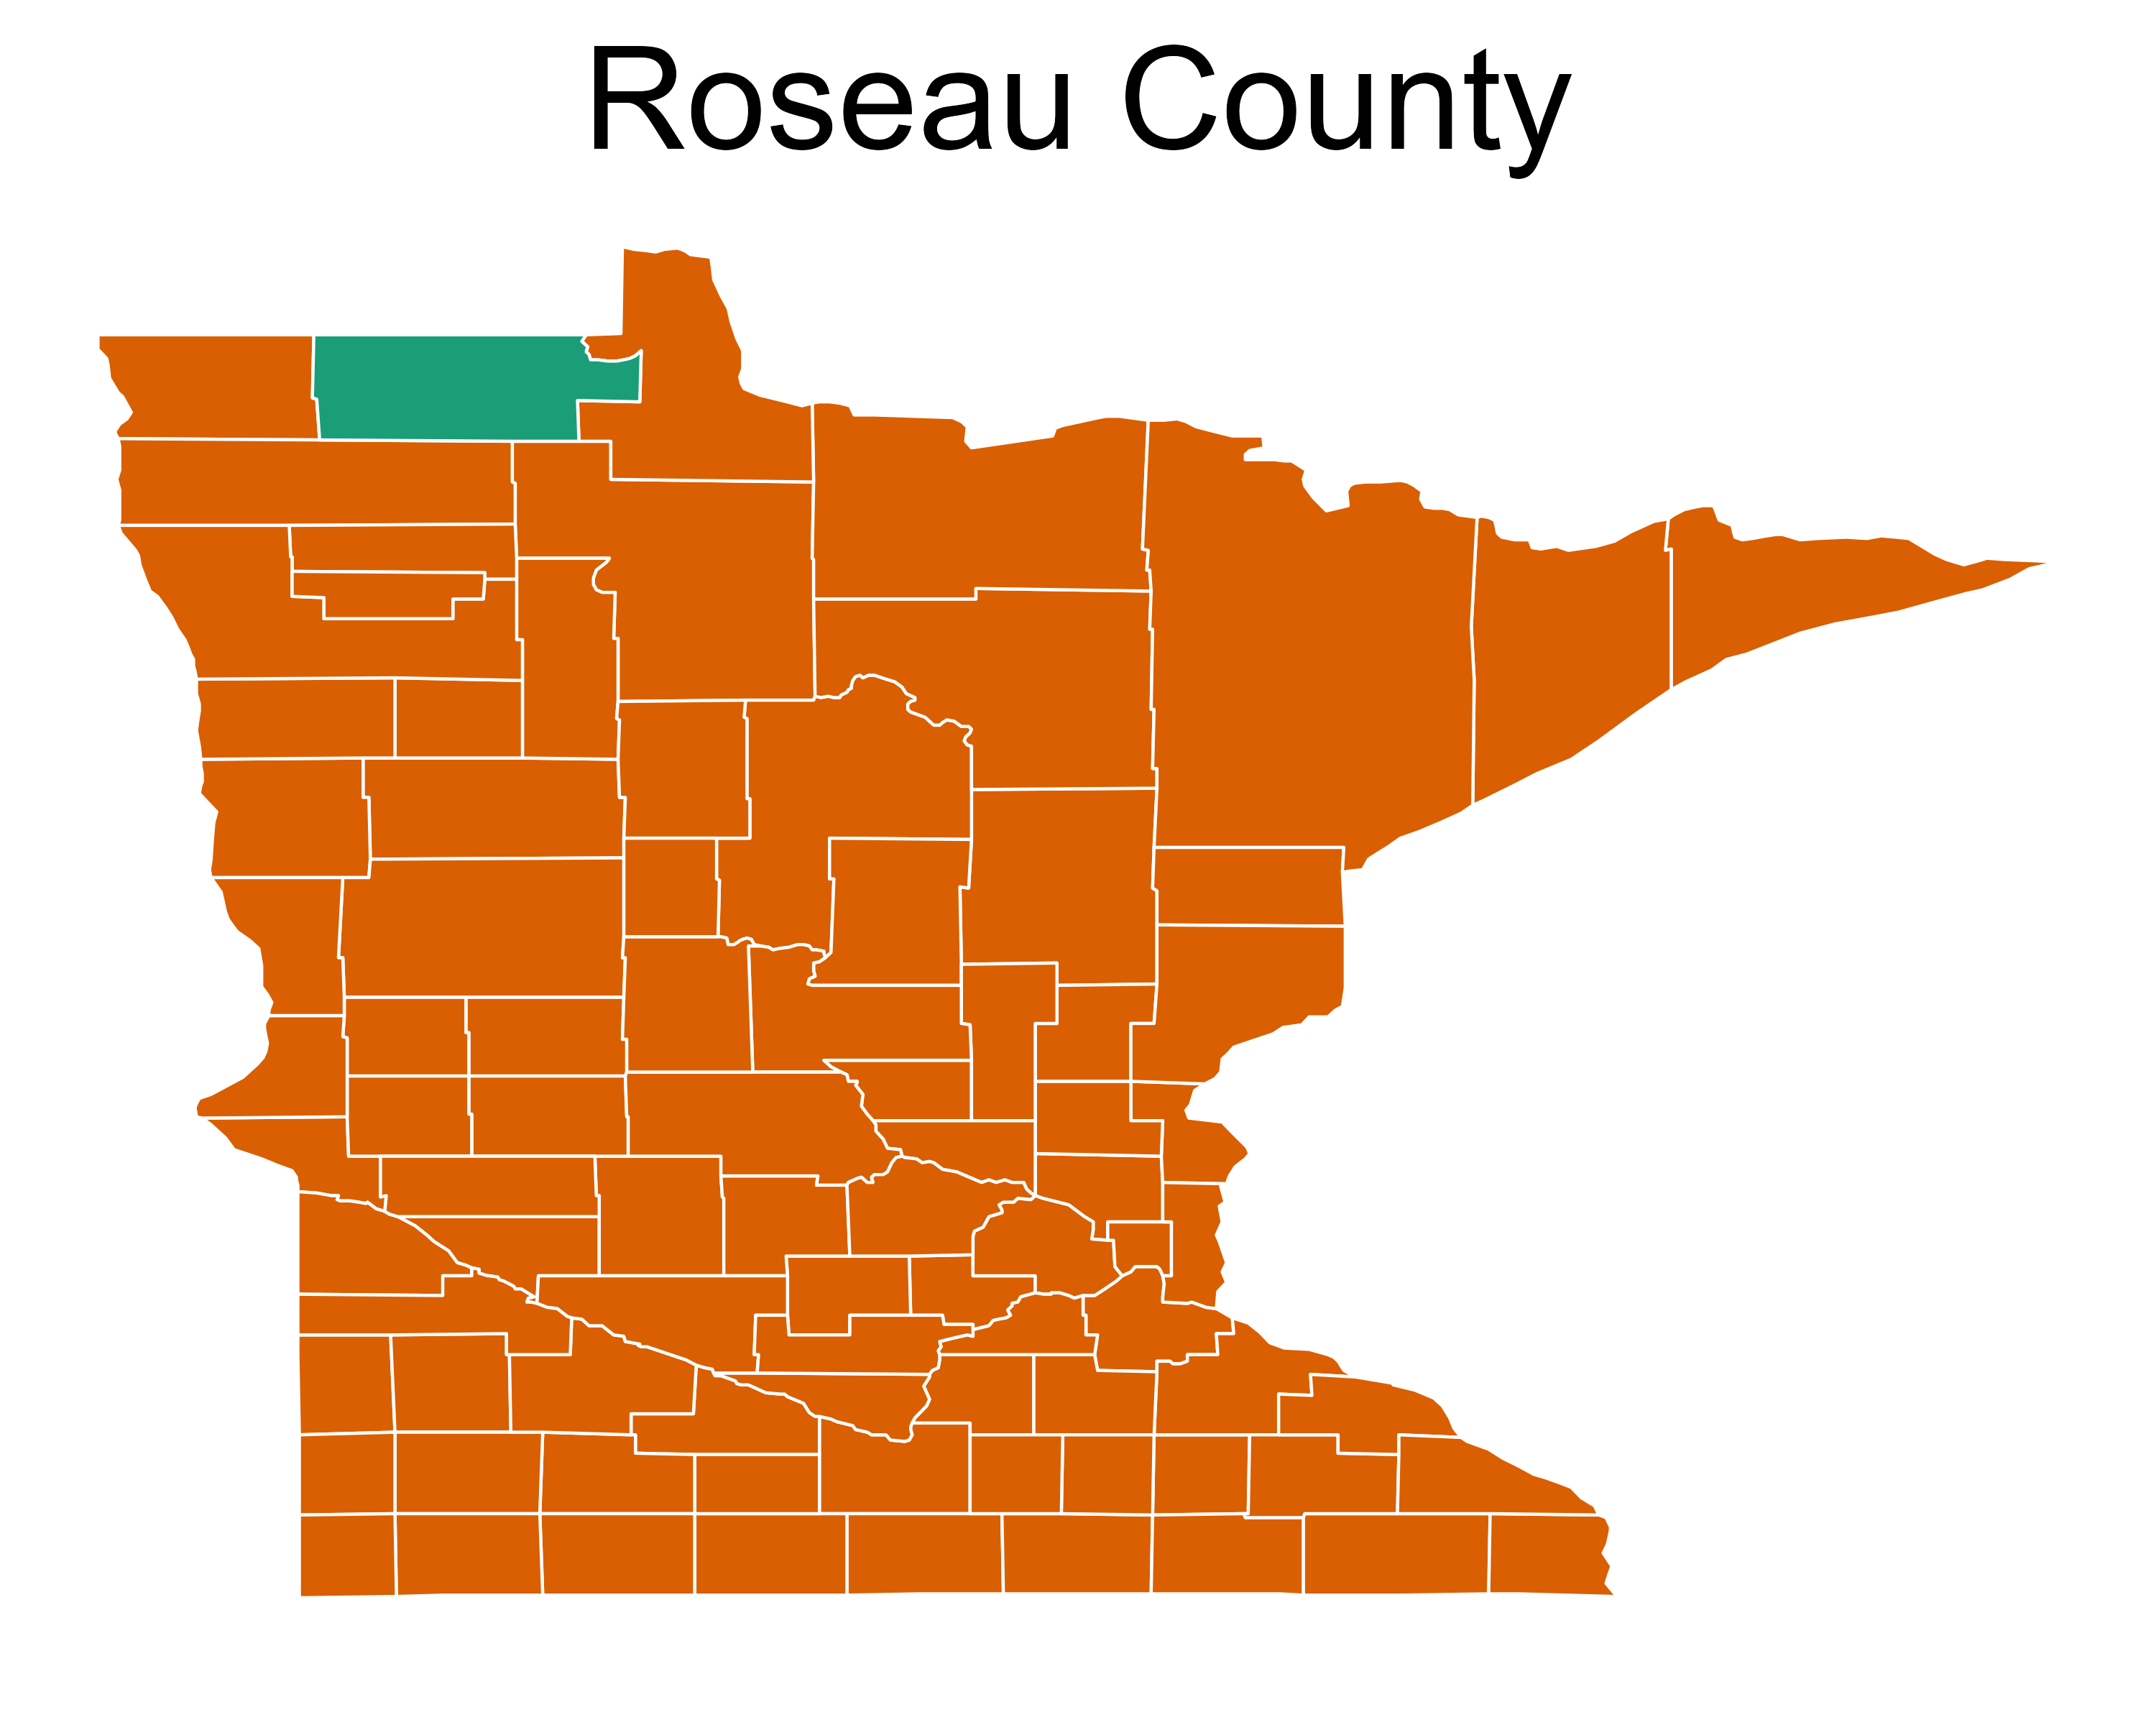

The state of Minnesota has a total land area of 79,631.54 per square (sq) mile. Quin County Community Health Services (CHS) area covers 5,594.73 sq miles, with Marshall county having the largest land area (1,775.06 sq miles) followed by Roseau county (1,671.74 sq miles), Kittson county (1,099.00 sq miles) Pennington county (616.52 sq miles), and Red Lake county (432.41 sq miles). Minnesota has an average of 71.5 people living in each sq mile. In comparison, the Quin County CHS area has only 8.3 people per sq mile (Centers for Disease Control and Prevention/ Agency for Toxic Substances and Disease Registry/ Geospatial Research, Analysis, and Services Program 2022).
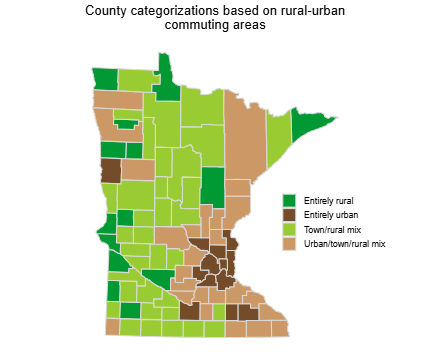
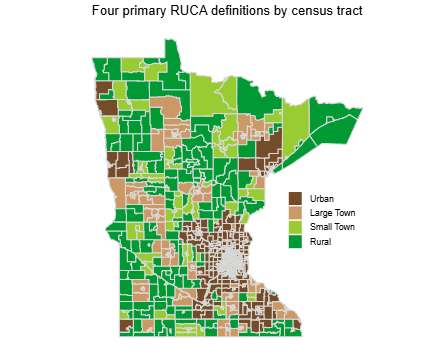
In these five counties, people are significantly more dispersed compared to the state average. Population density, which measures the number of people per square mile, gives us an idea of how rural an area is, though it’s not the sole indicator. As shown on the following maps, Marshall County has two Census Tracts that prevent it from being entirely rural. However, it still meets a key criterion of a frontier area, with a population density of at least six or fewer people per square mile (Rural Health Information Hub 2024).
The state of Minnesota had a population of 5,706,494 people. Quin County CHS area had a total residential population of 46,505. This makes up 0.81% of Minnesota’s population (46,505/5,706,494) (U.S. Census Bureau 2020).
Over the next decade, the number of individuals aged 65 and older is projected to increase. This demographic shift could result in shortages in the workforce, long-term care housing, and supportive services. The median age in the Quin County CHS area provides further insight into the aging population. Kittson county has the highest median age at 48 years, followed by Red Lake county at 42.9 years, Marshall county at 42.8 years, Roseau county at 42.1 years and Pennington county at 39.8 years. For comparison, the median age for the state of Minnesota was 38.5 years. The combined median age for Quin County CHS area was 42.1 years, though this figure should be interpreted with caution as it wasn’t calculated from the raw data (U.S. Census Bureau 2022)
Median age is used instead of the average age because it gives a clearer picture of the community’s age. The median age is the middle point, so it isn’t skewed by very young or very old individuals. This way, we get a better idea of the typical age in the community.
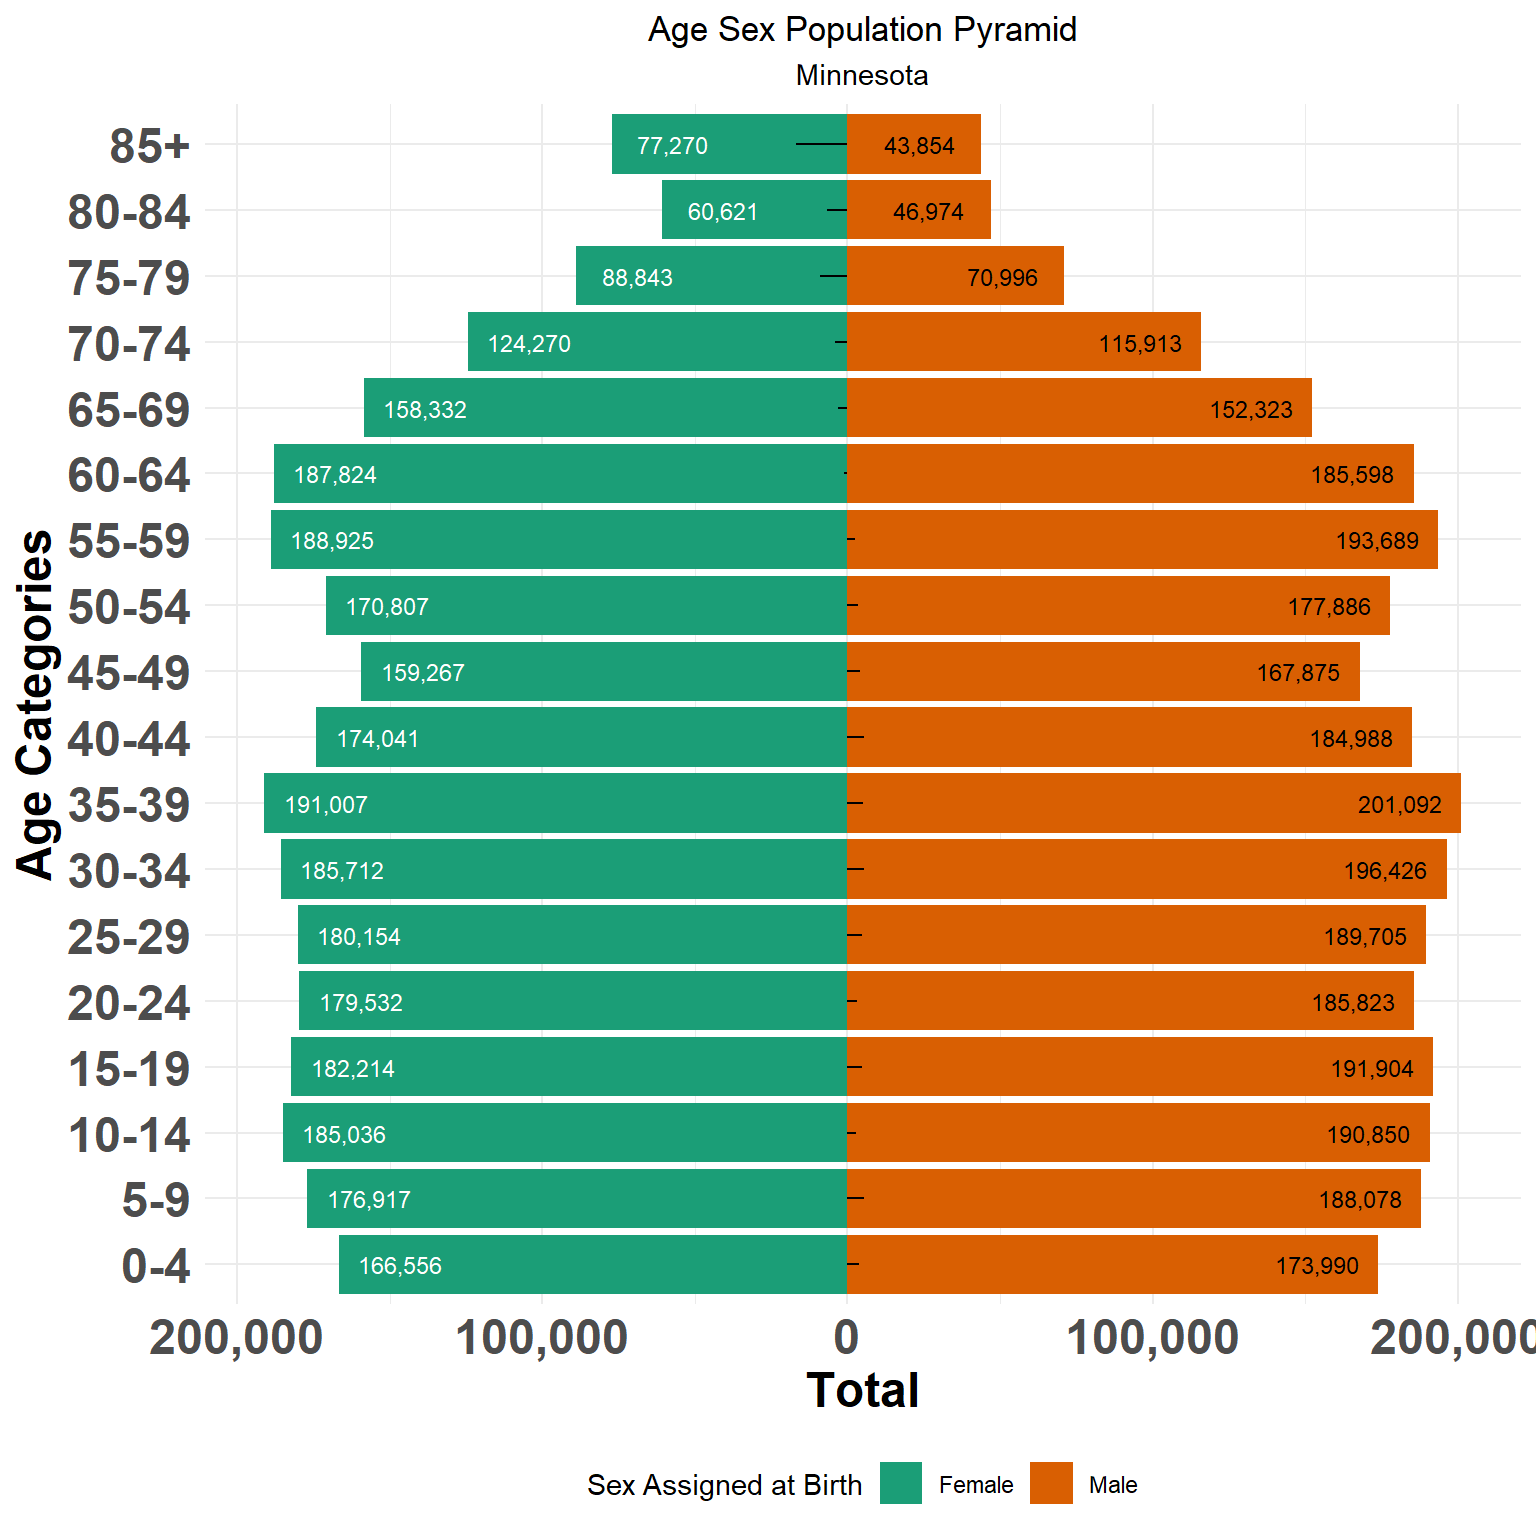
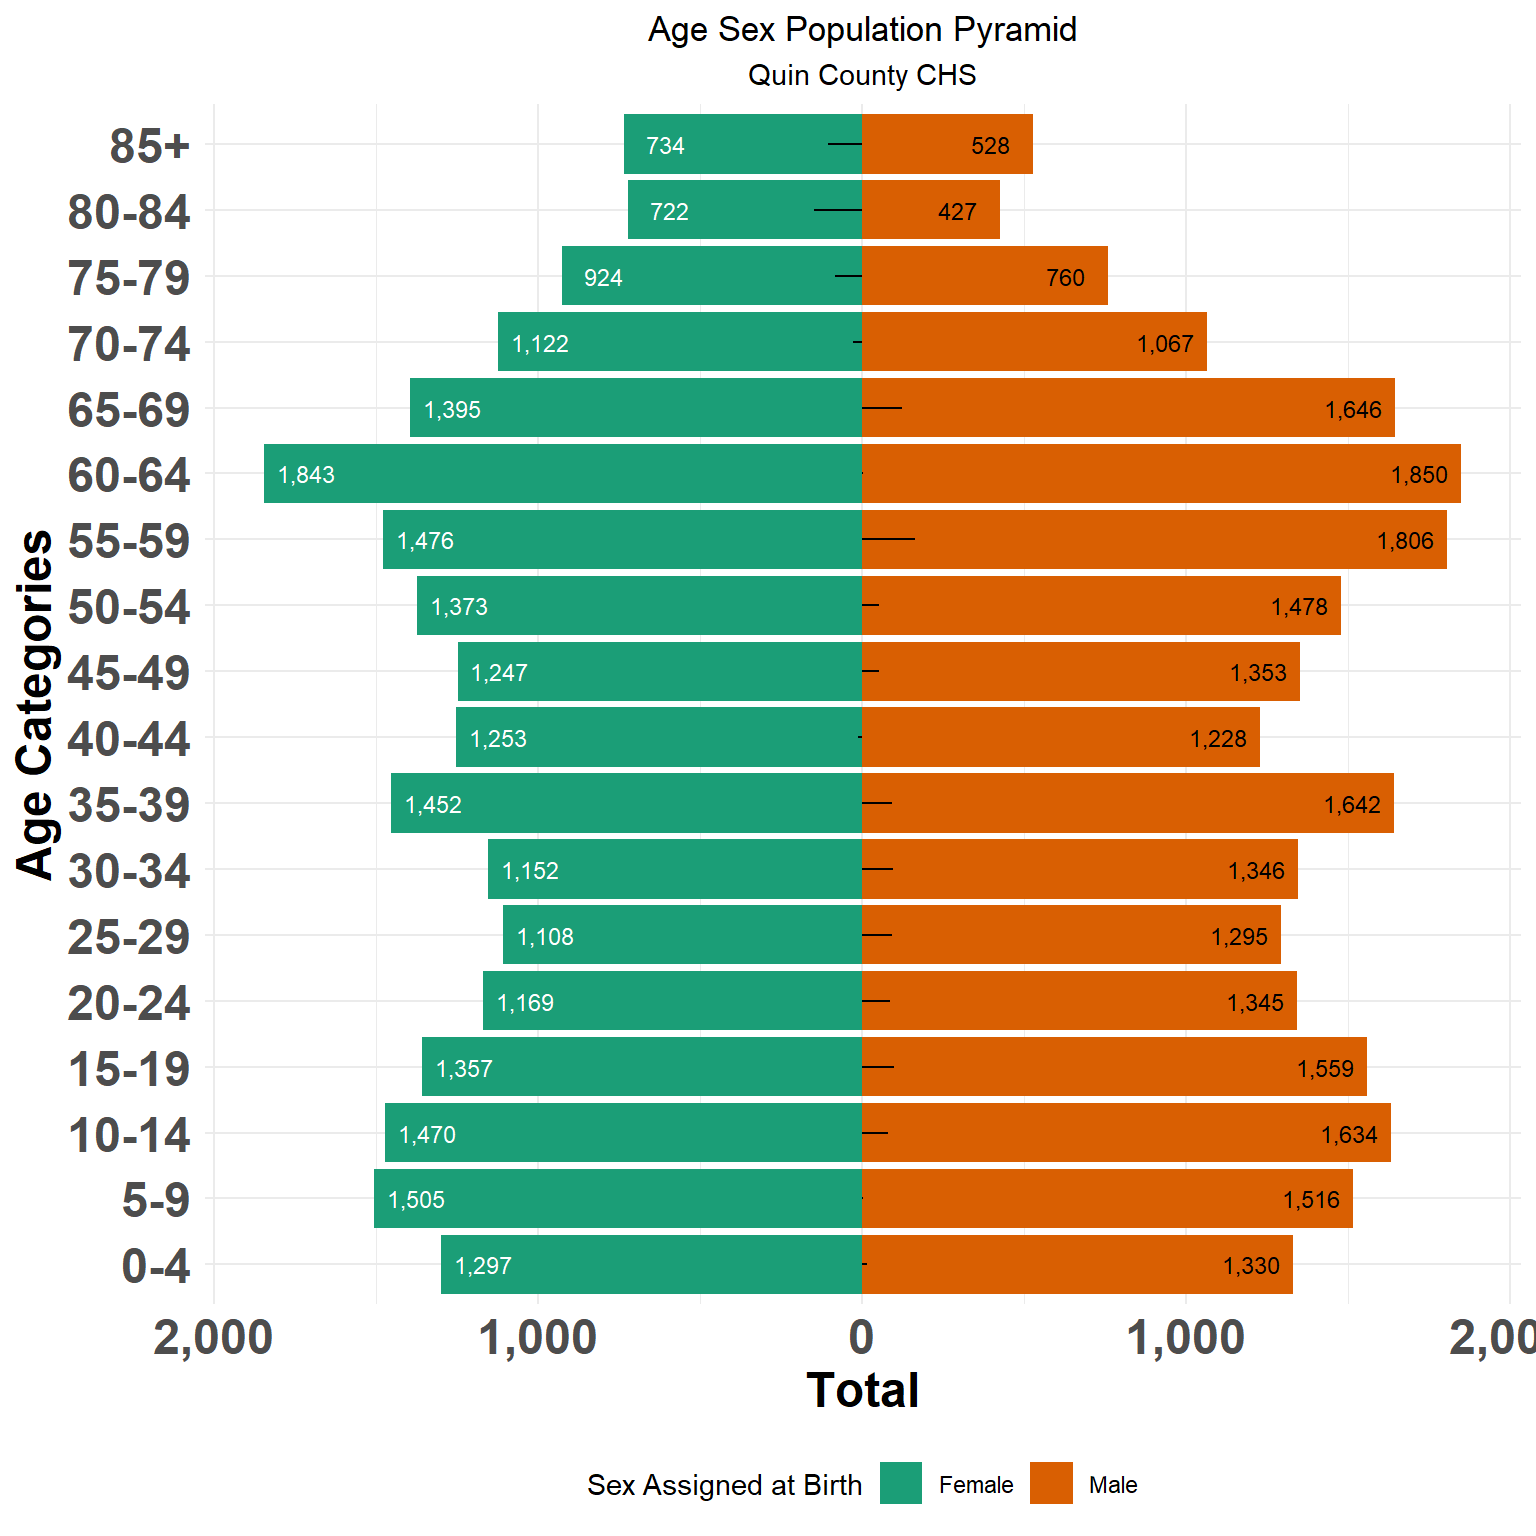
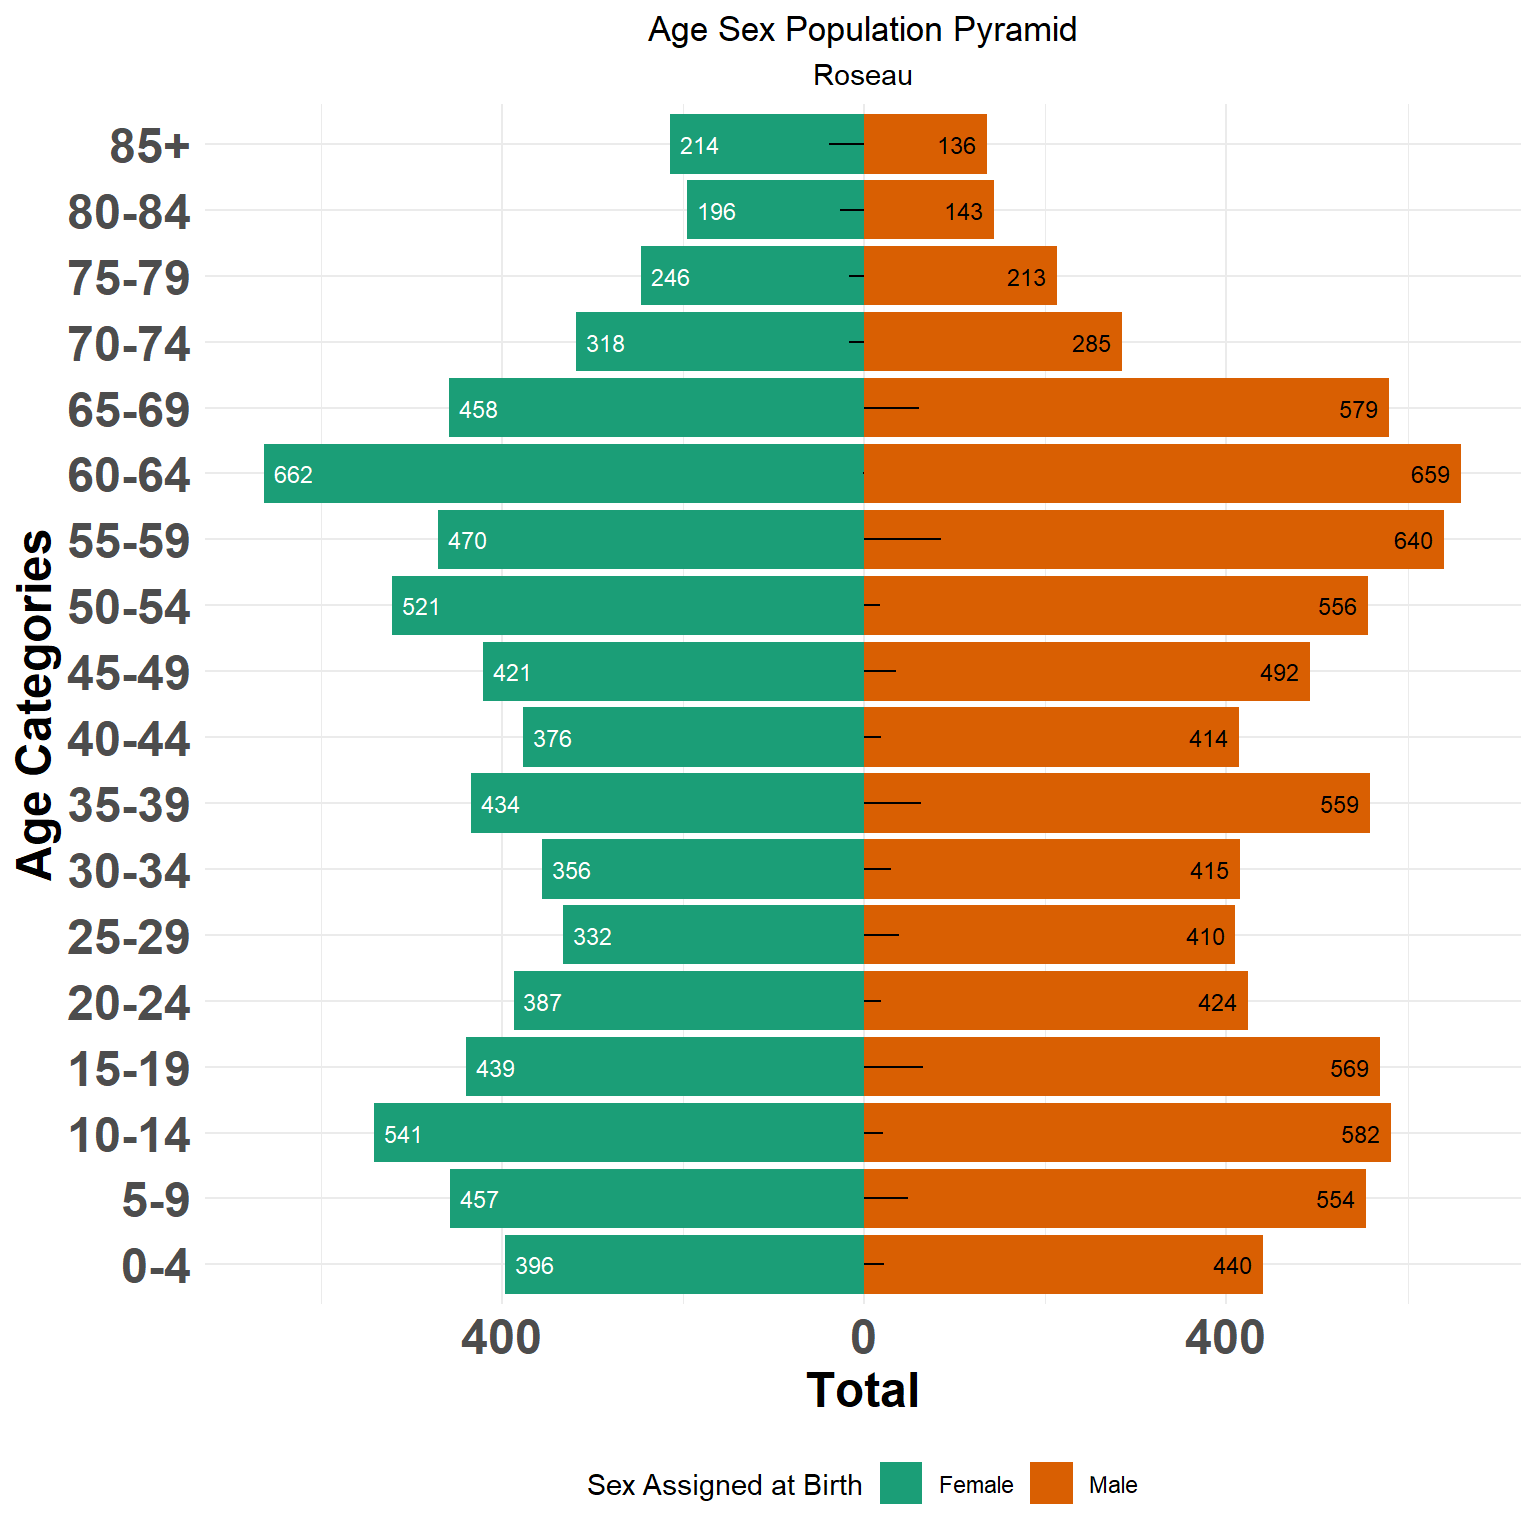
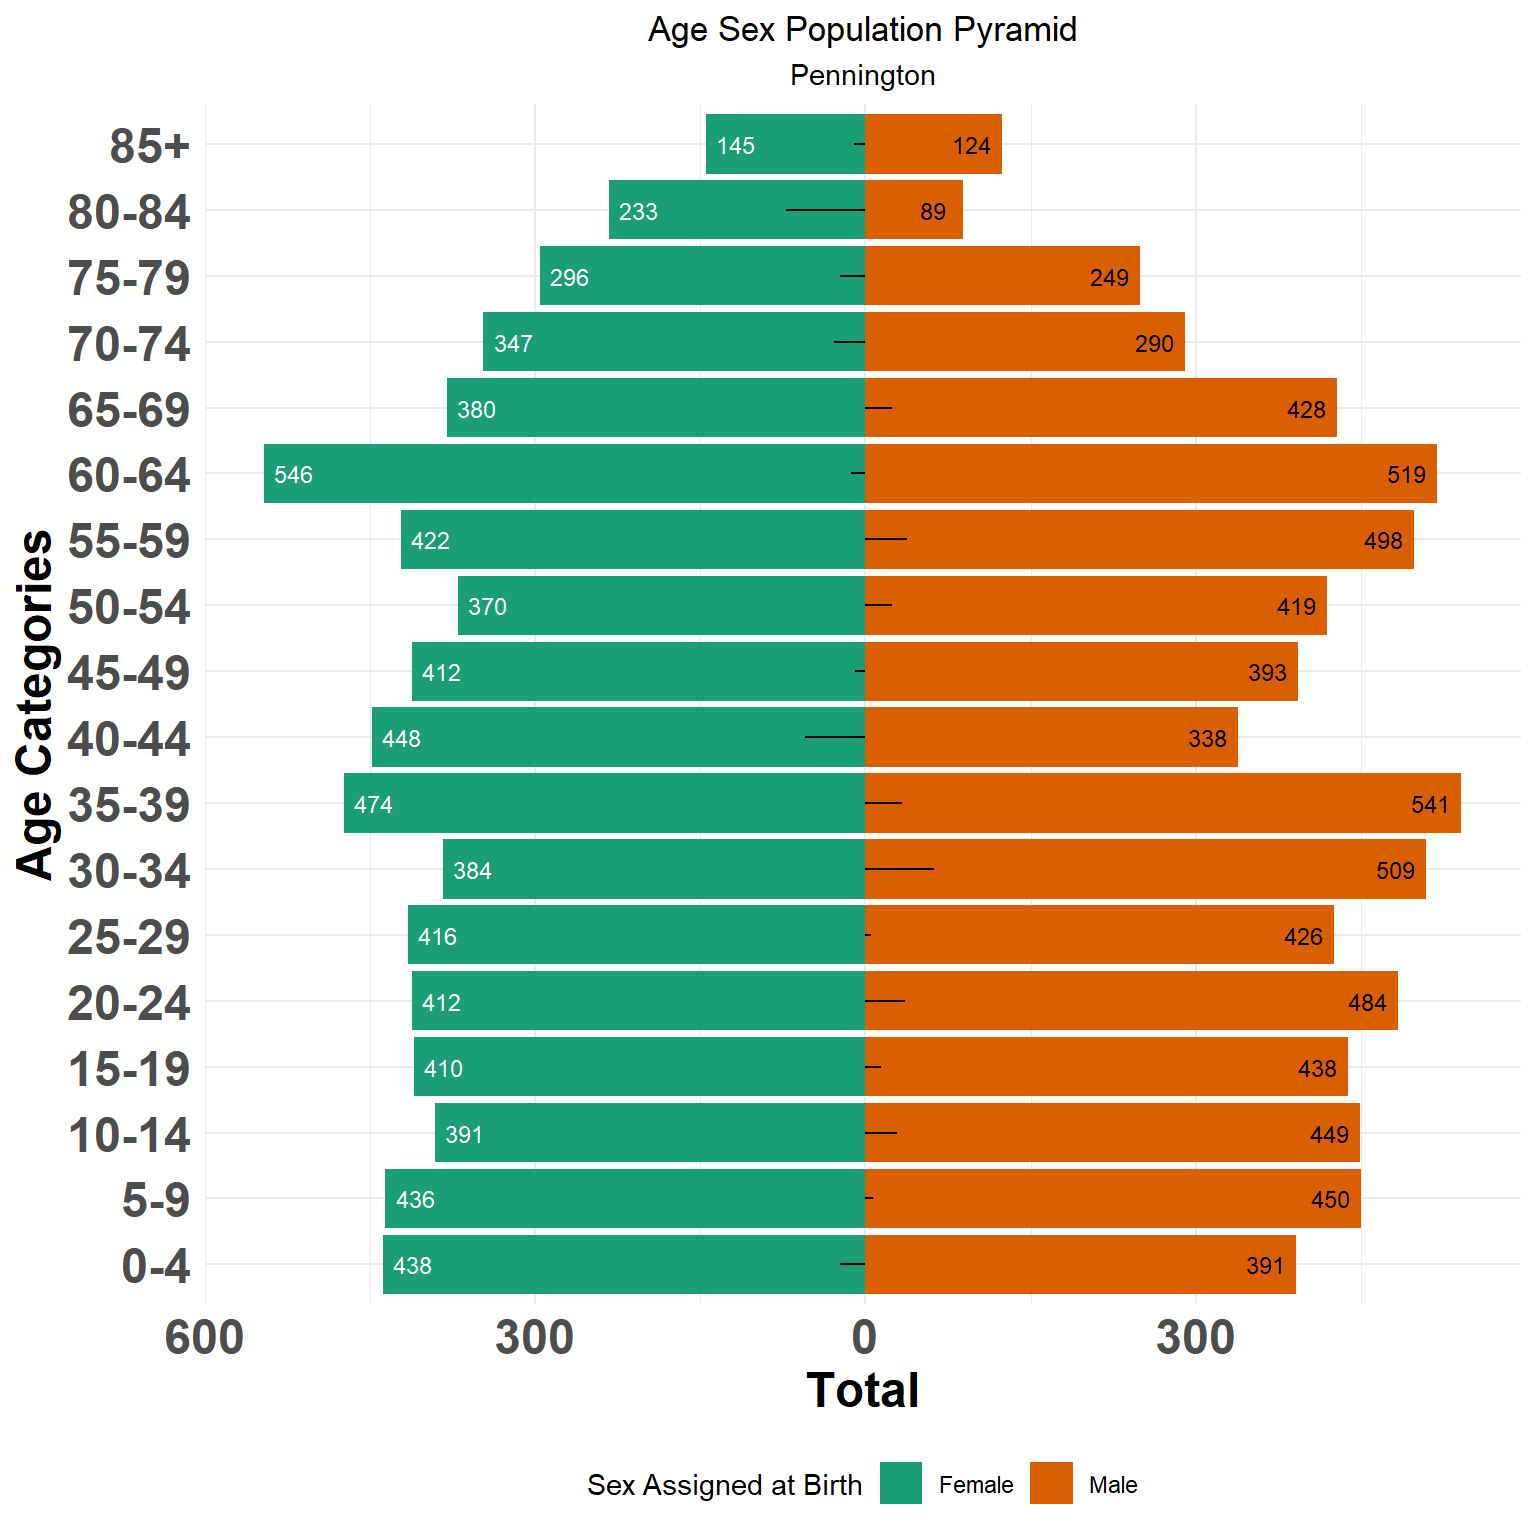
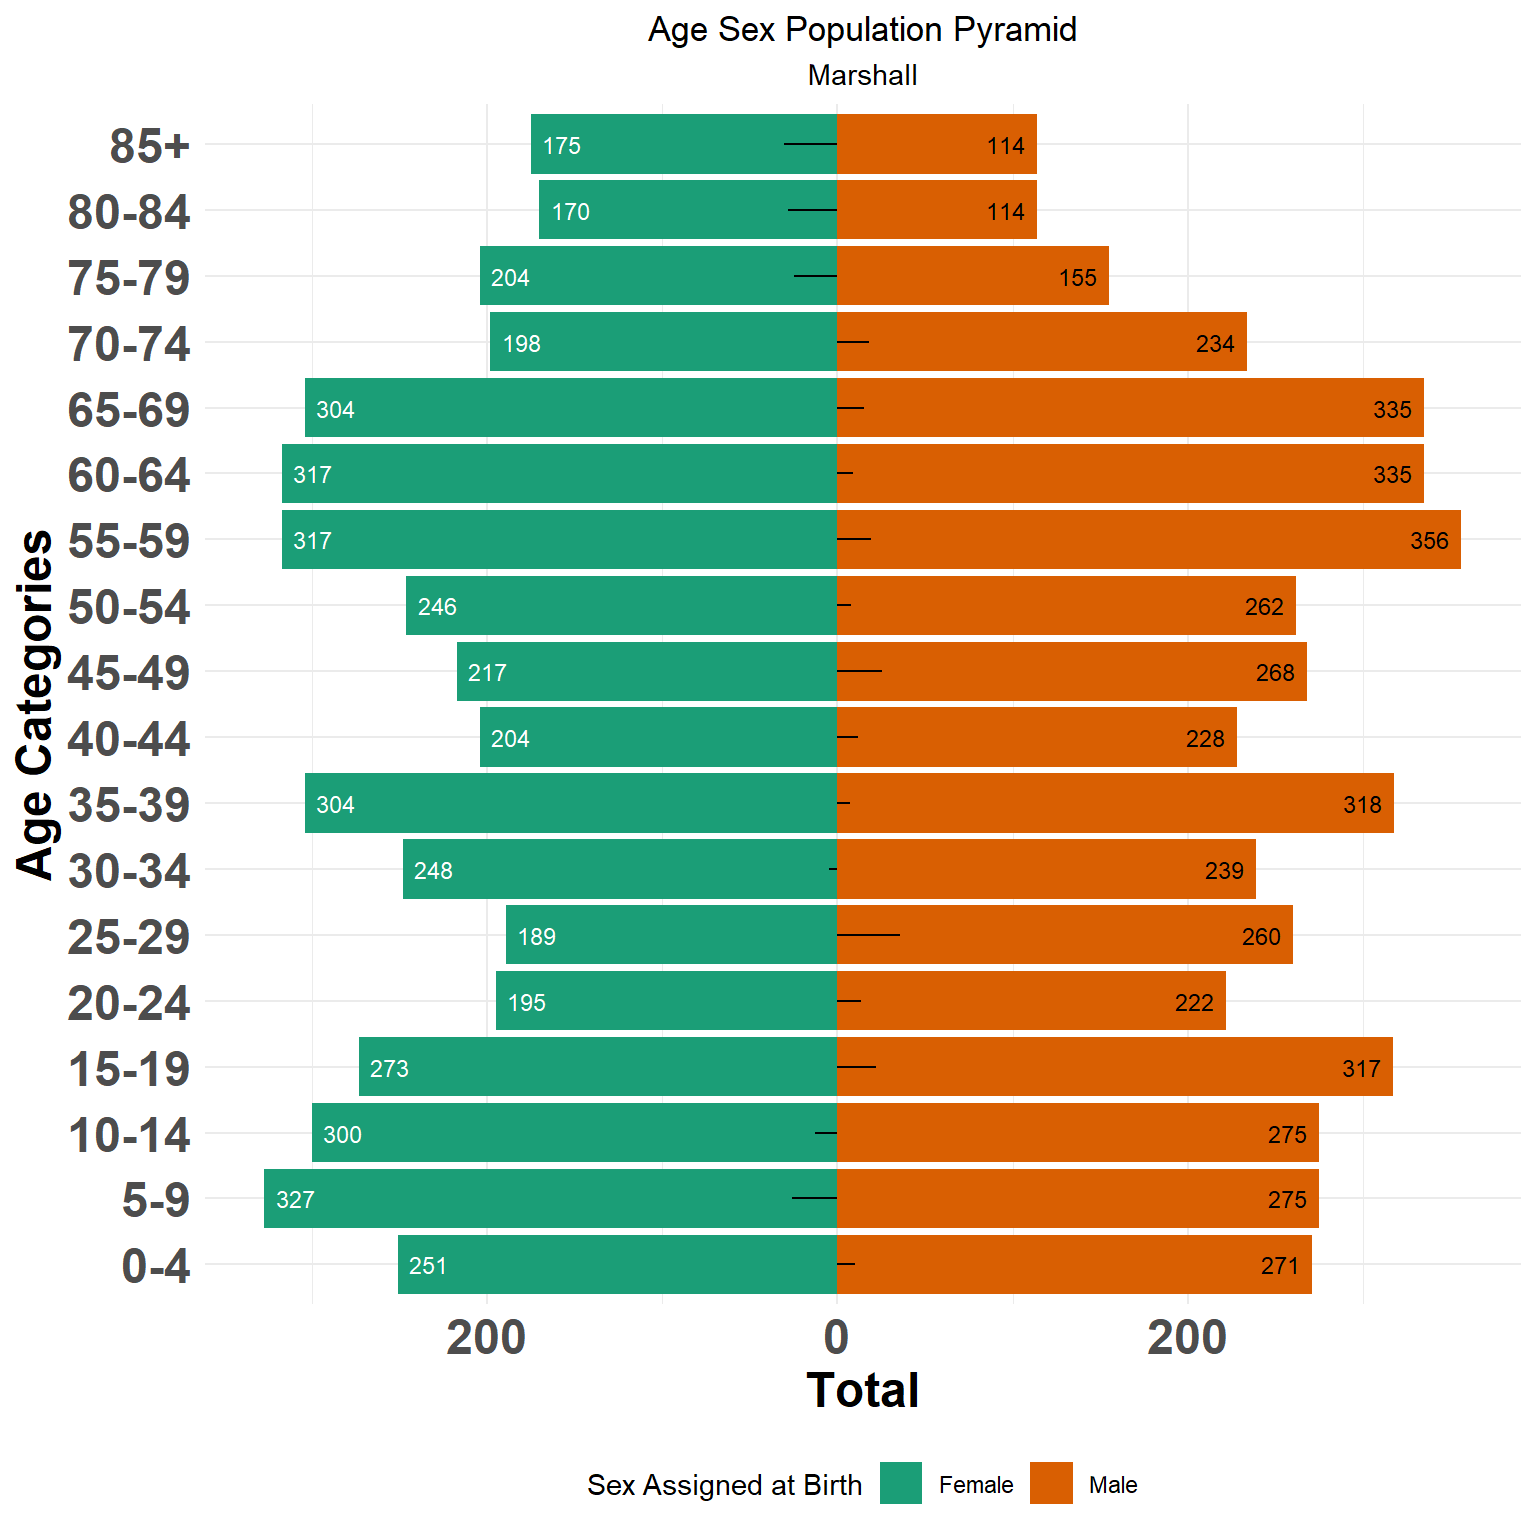
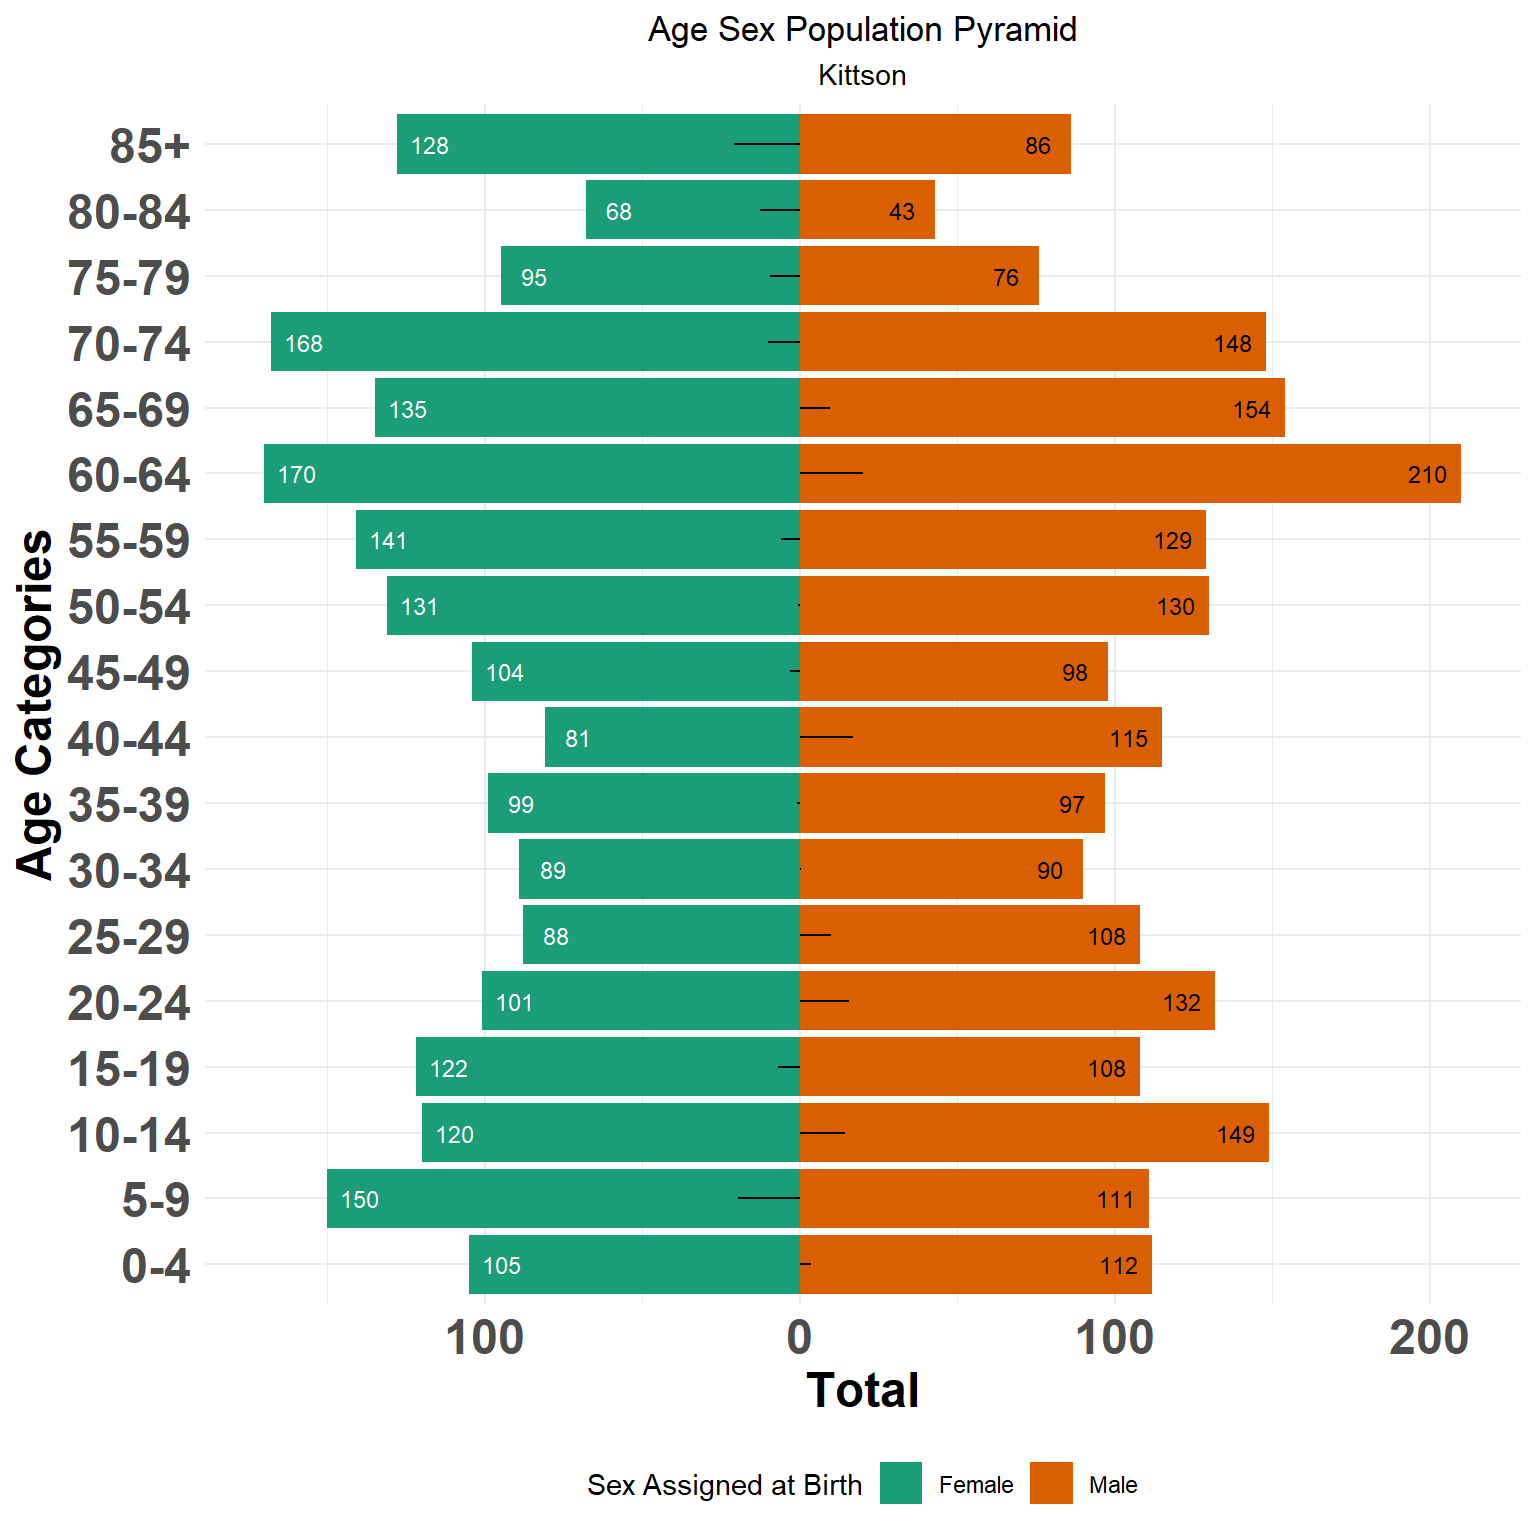
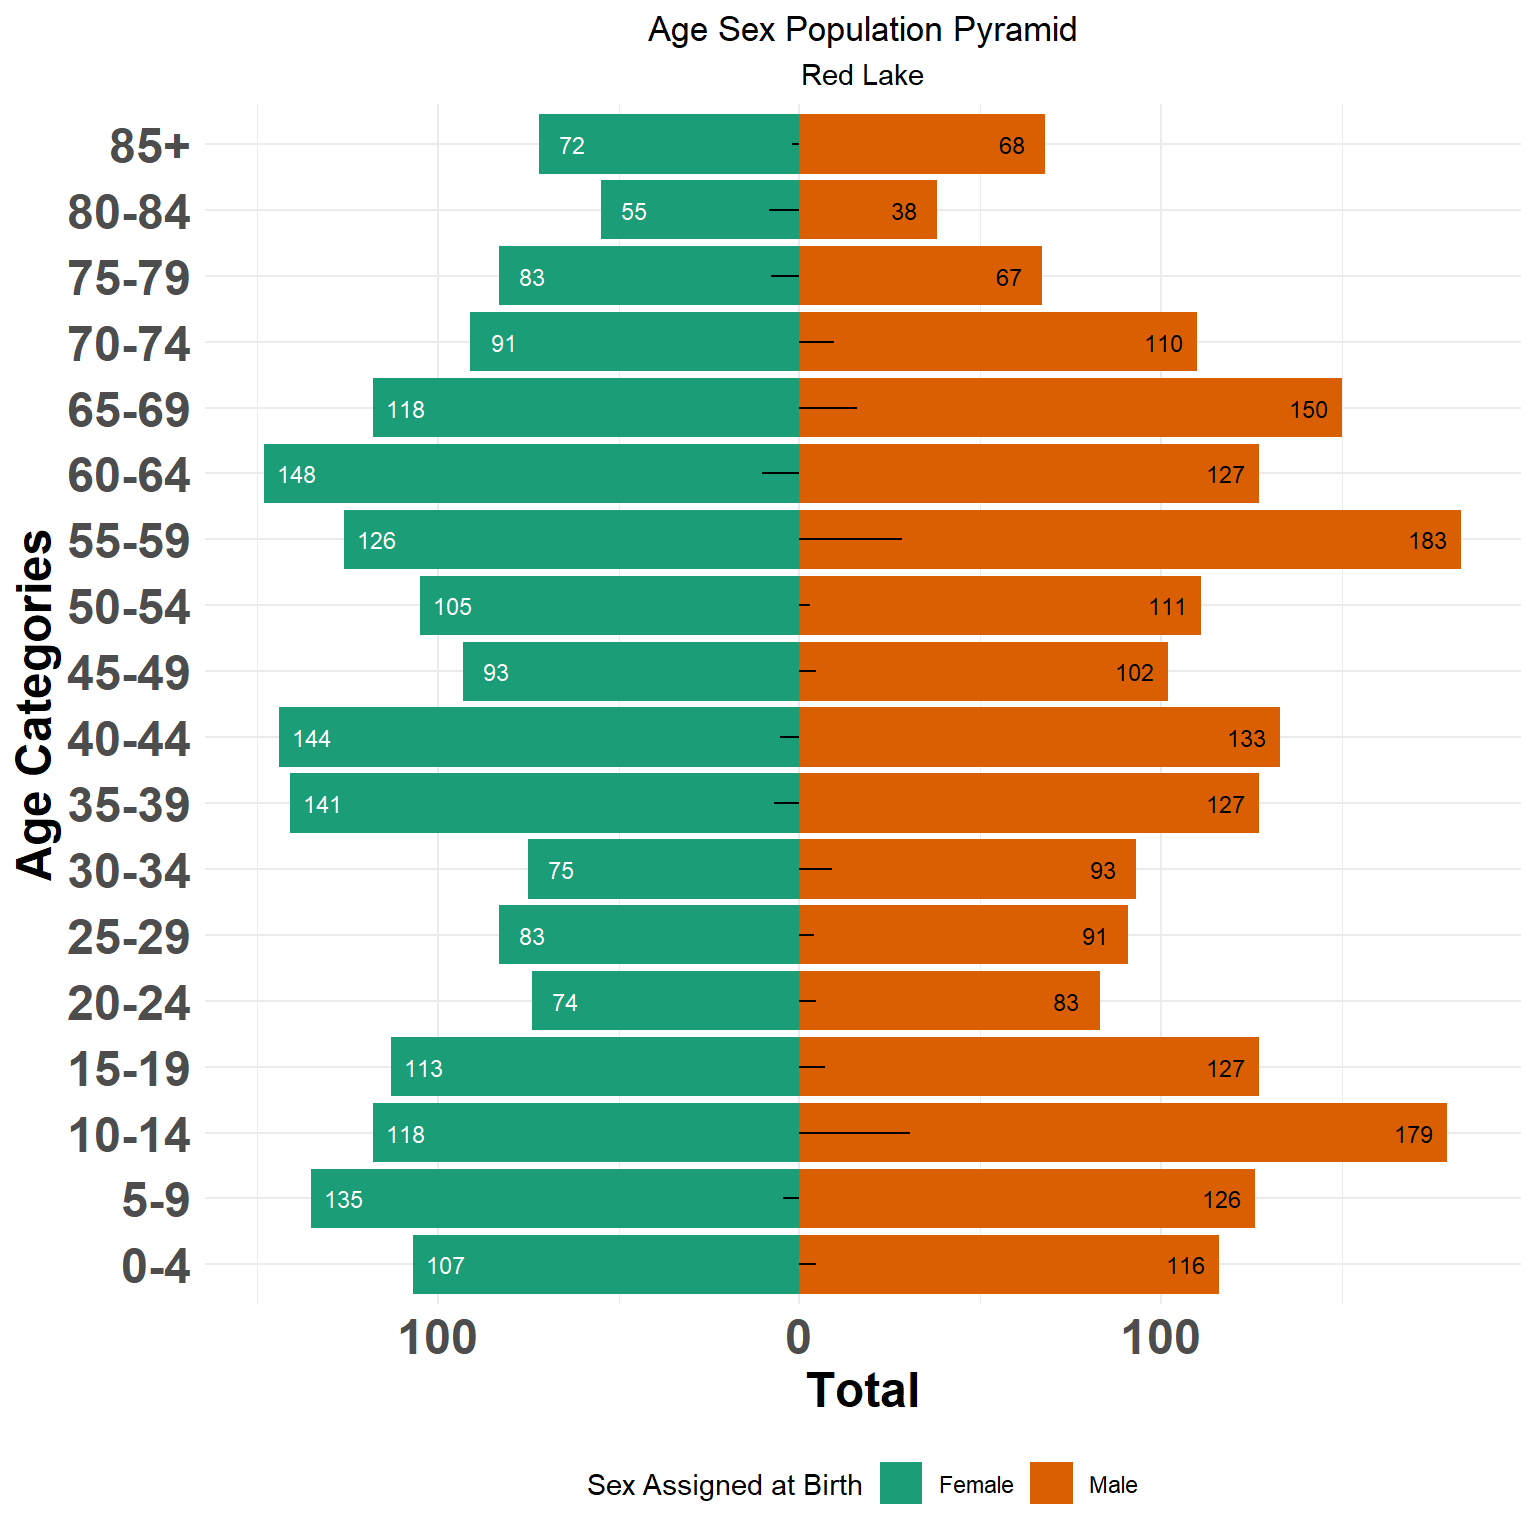
The Age Sex Population Pyramids below illustrate a generally balanced distribution of males and females across most age groups. You can determine the balance by examining the horizontal solid black midpoint line: a longer line indicates a greater difference between the male and female populations within that age group. The Age Sex Population Pyramids are based on the U.S. Census Bureau (2022) estimates. While there is a lot to examine, comparing Minnesota to the Quin County CHS area reveals that the midpoint line is similar, except for the age groups 65-69.
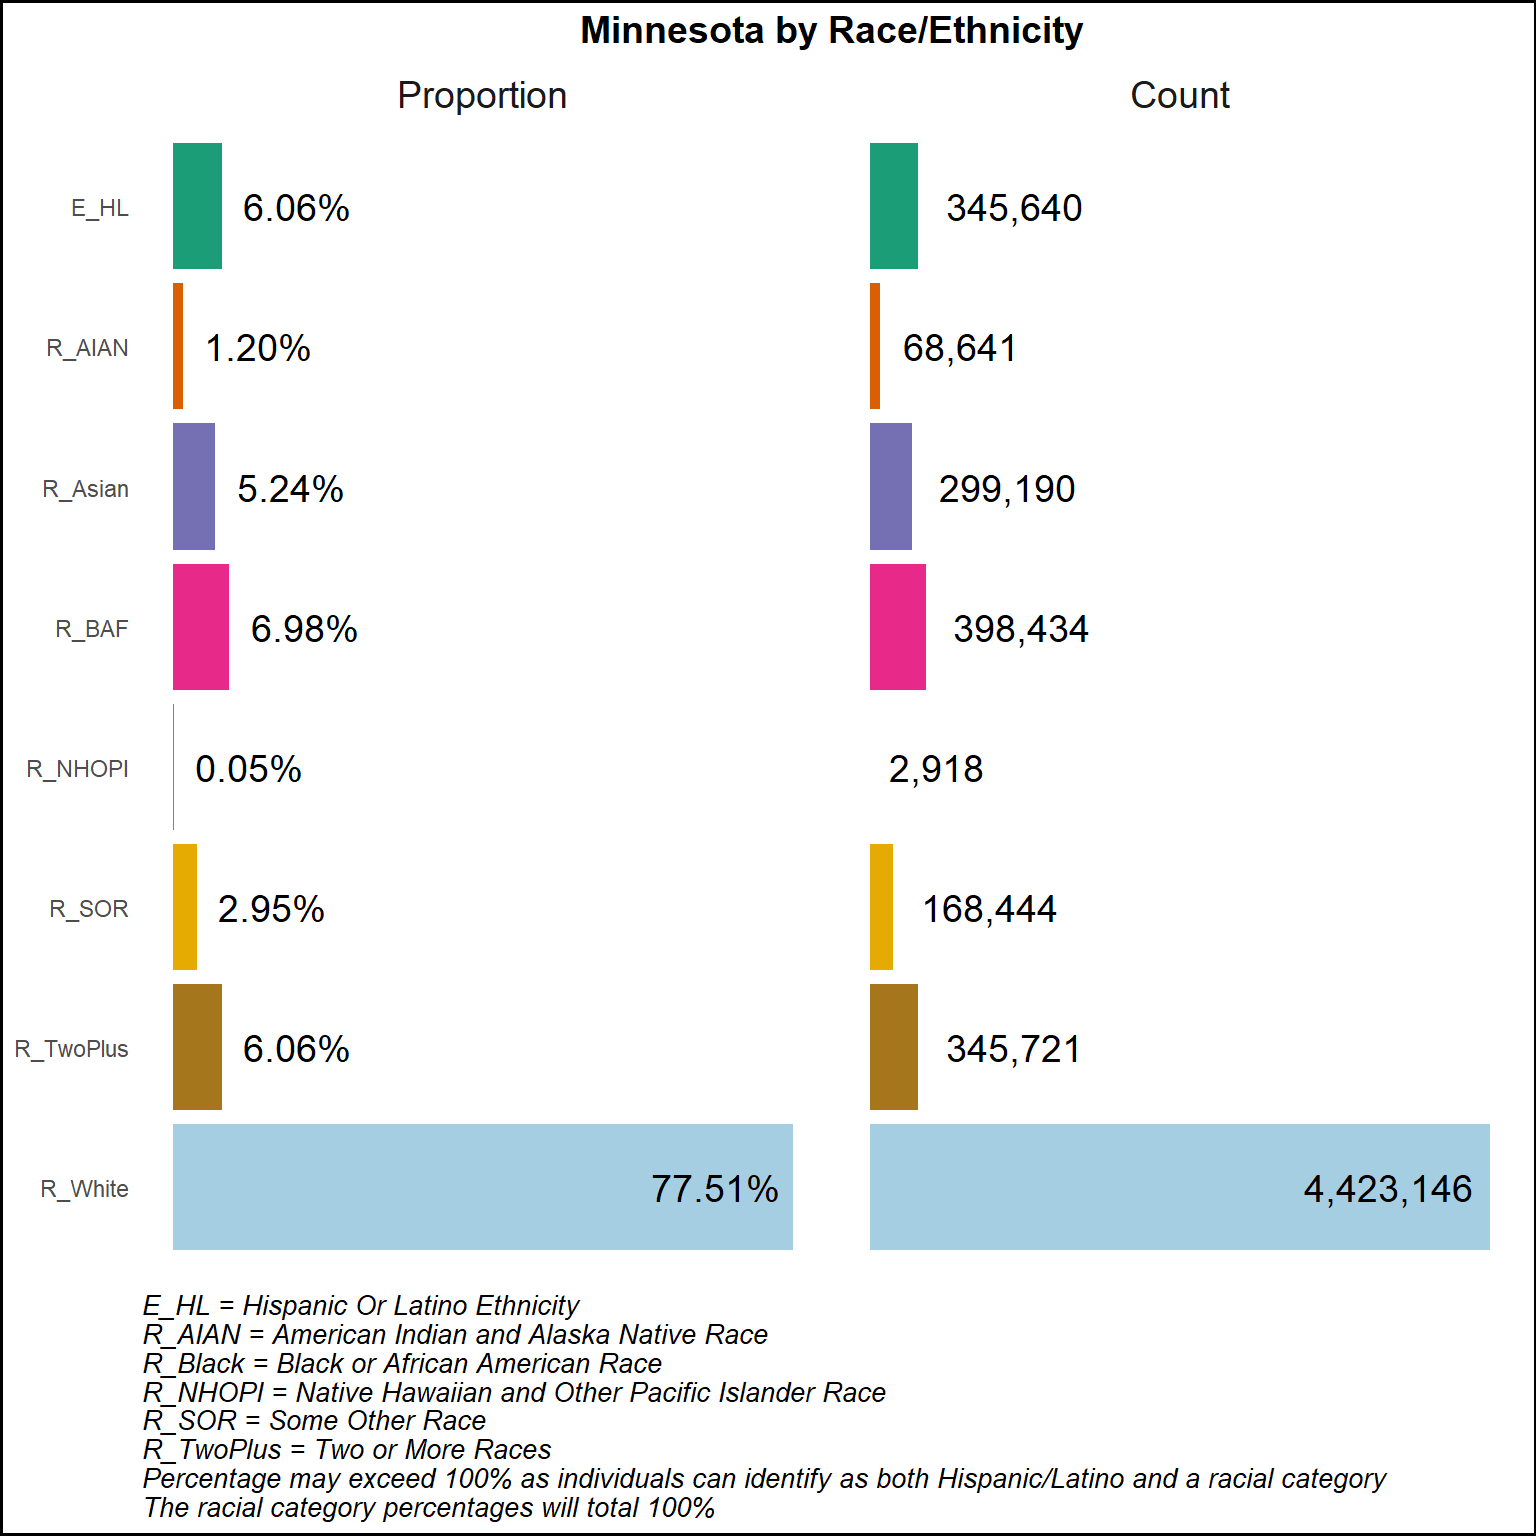
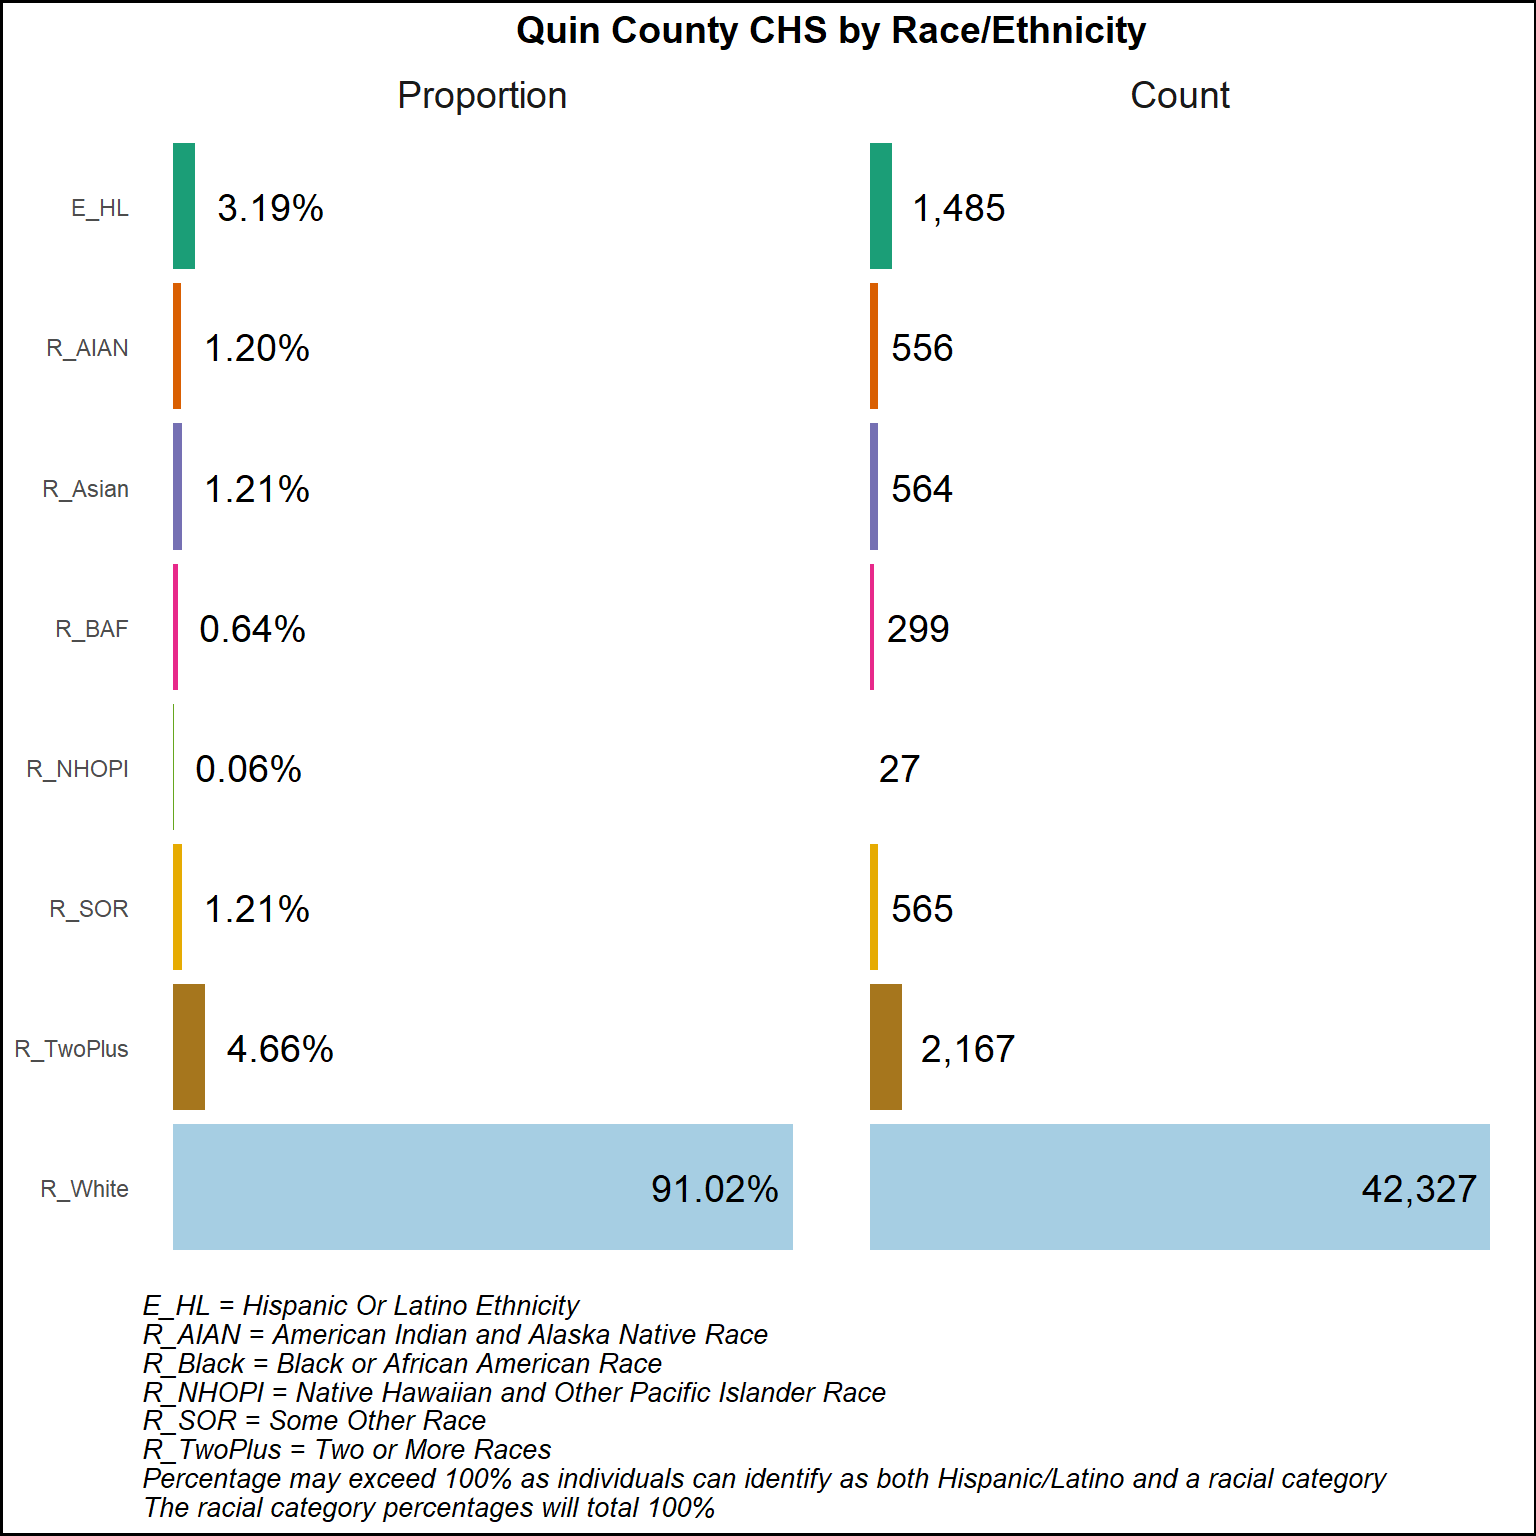
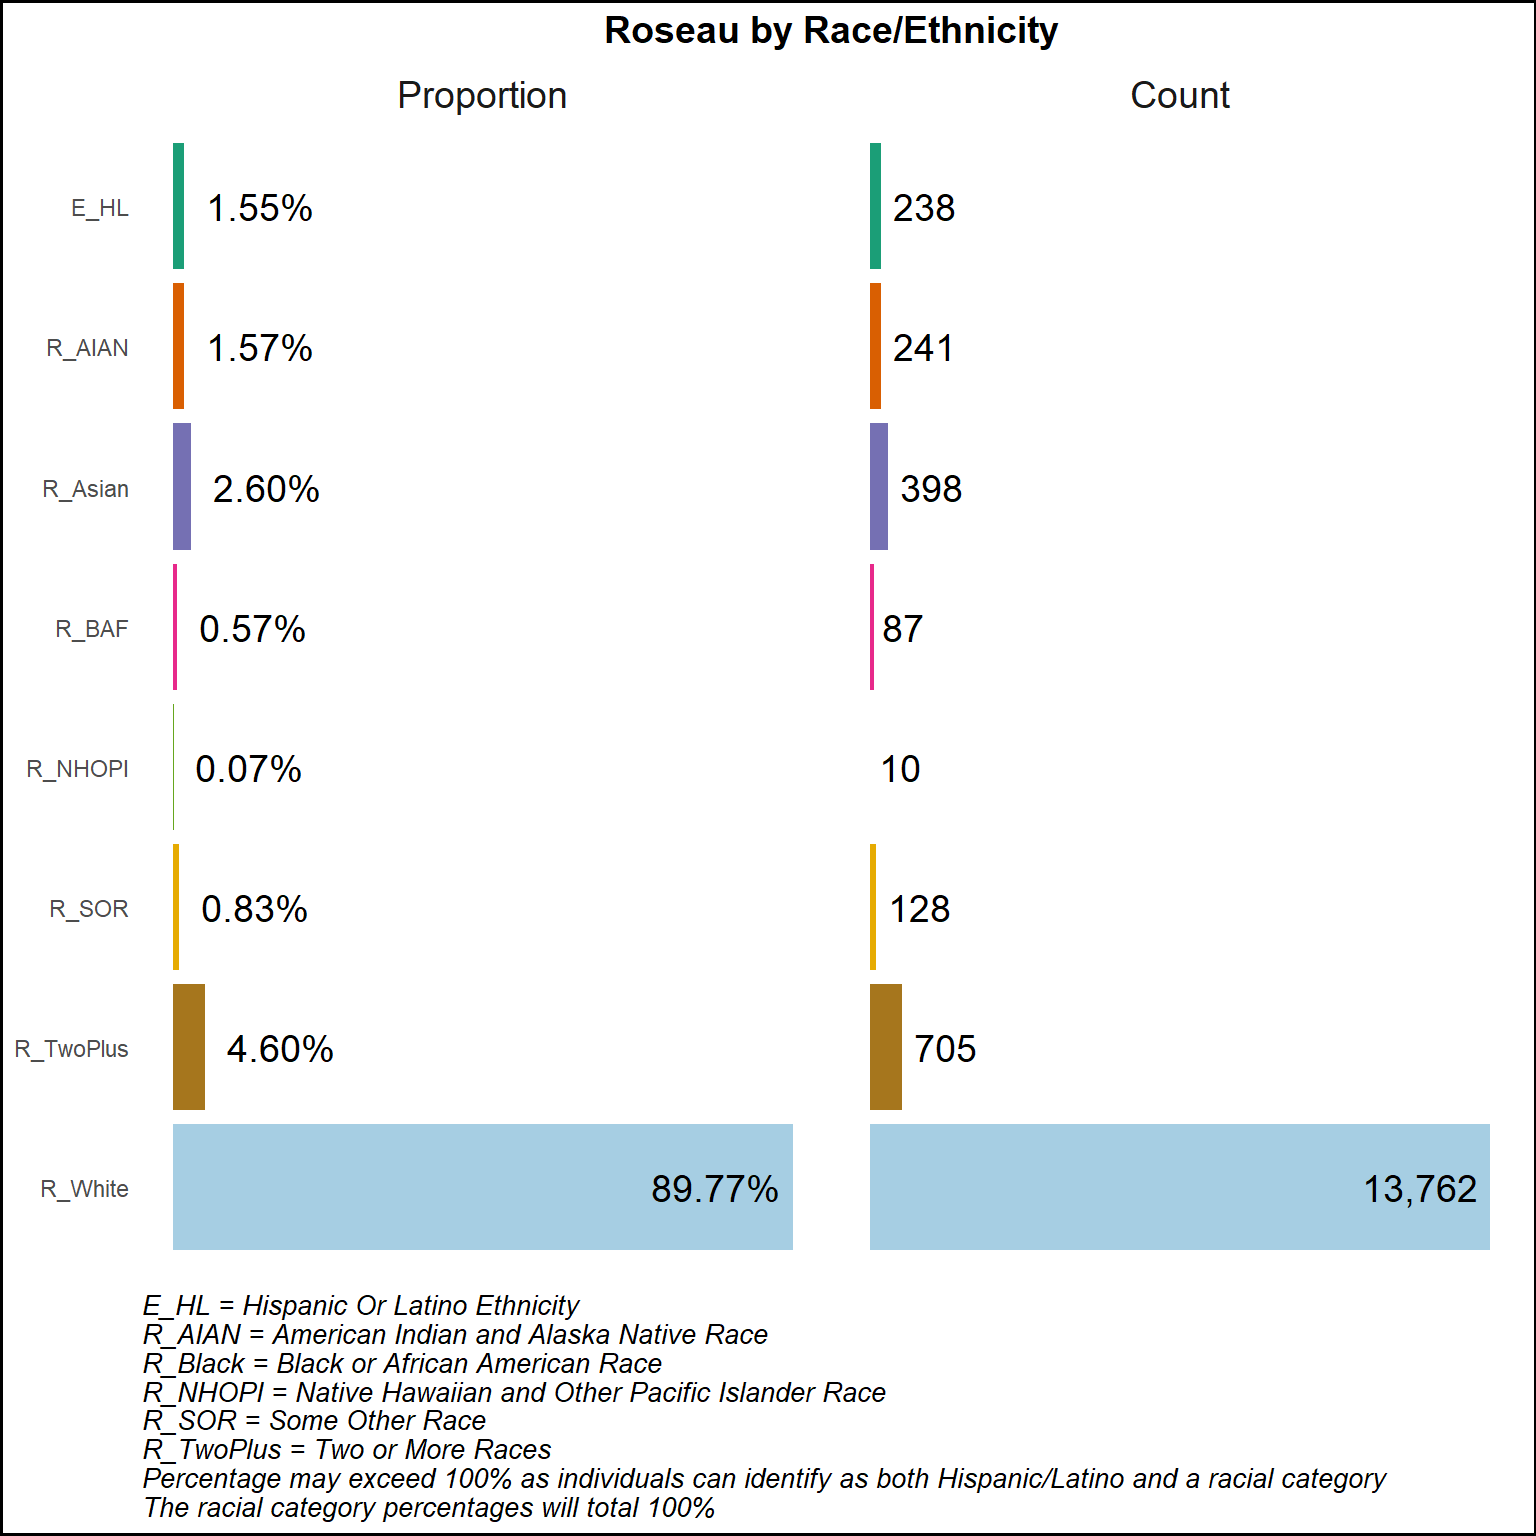
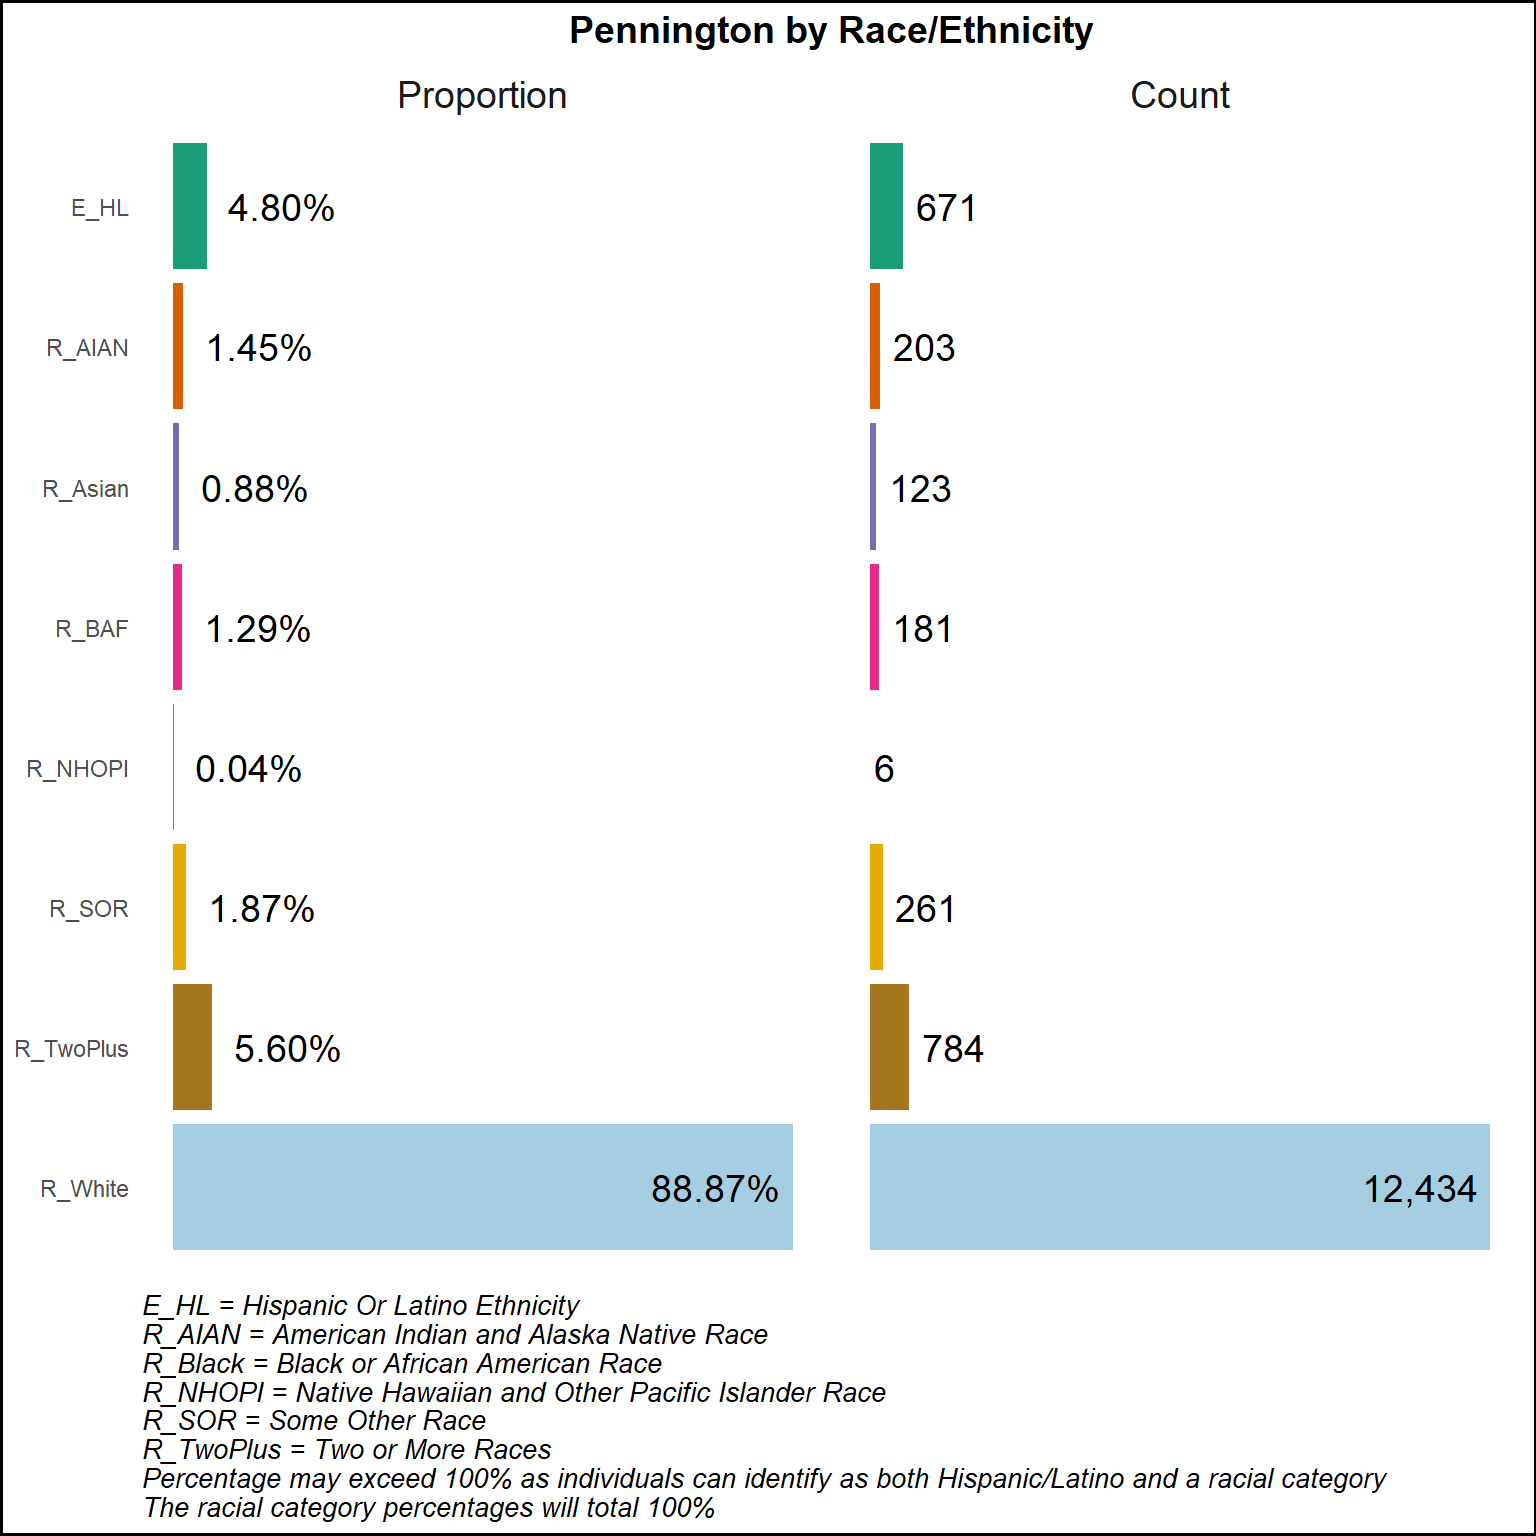
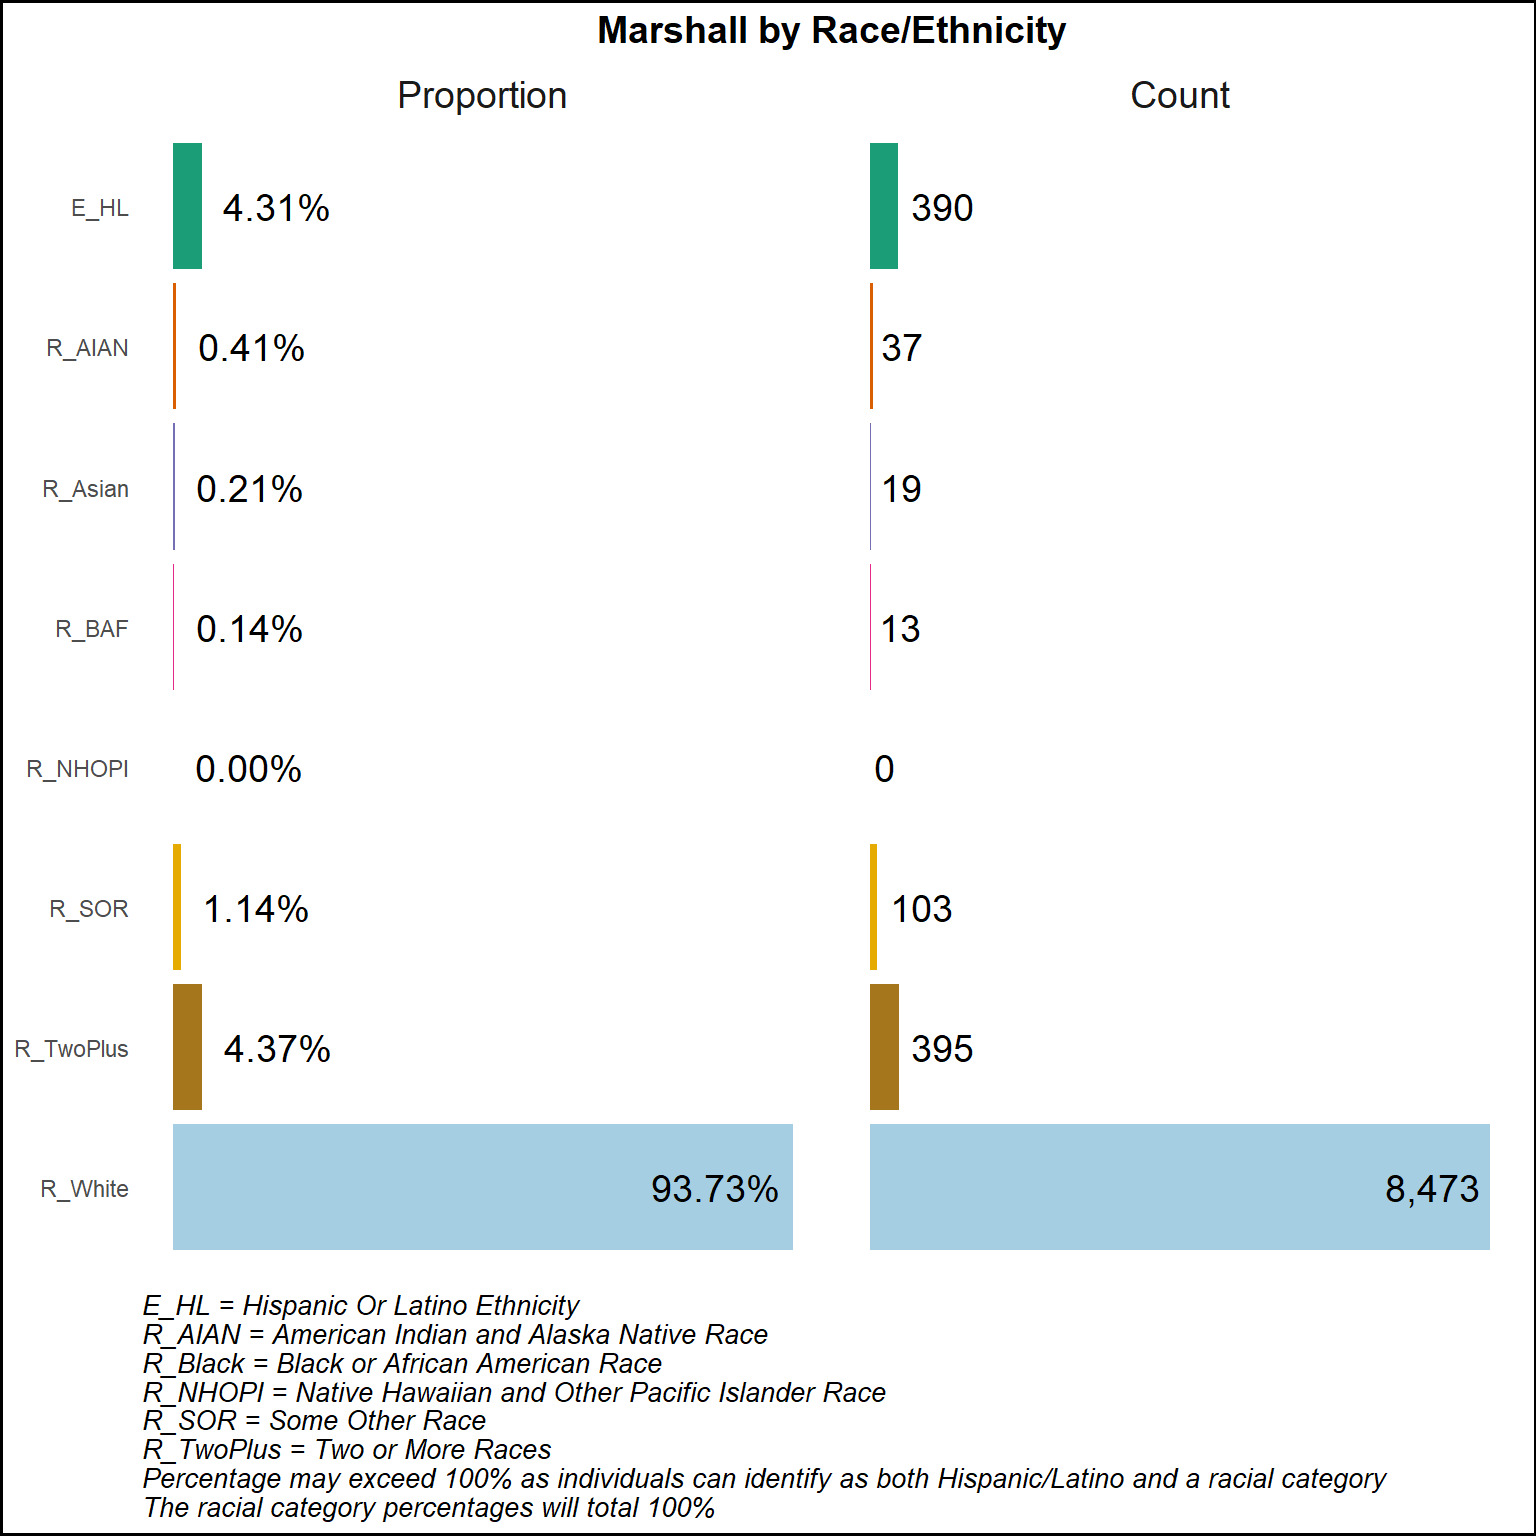
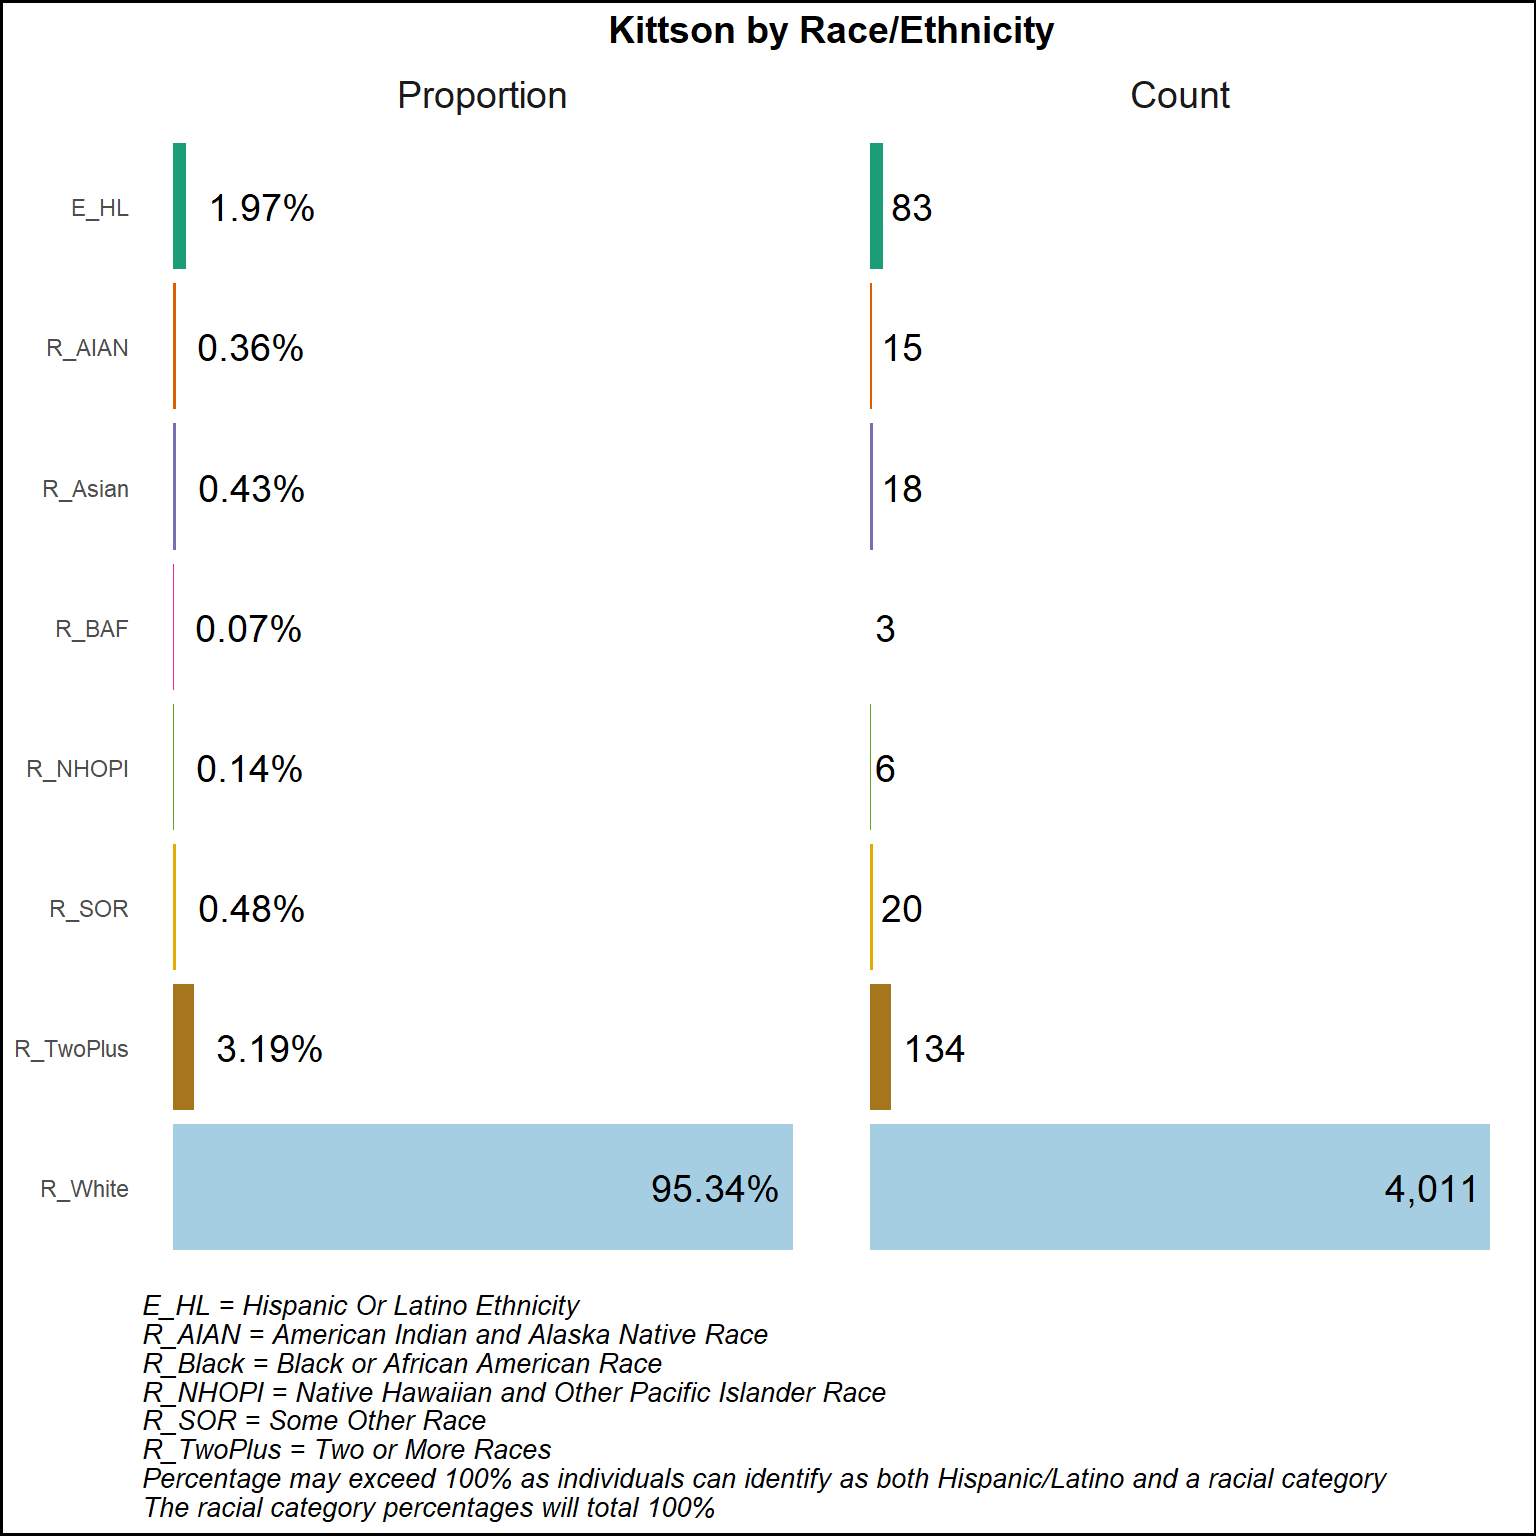
Based on the U.S. Census Bureau (2020) data, the White population represents the highest percentage in both Minnesota and the Quin County CHS area. Quin County CHS has more than 10% percentage of residents identifying as white compared to the state of Minnesota. Quin County CHS has relatively low ethnic and racial diversity. Although the area has relatively low ethnic and racial diversity, it still possesses a diverse community with a variety of backgrounds and experiences that enrich the local culture.