Factors Influencing Health
Health is influenced by various factors, including the quality of our education, workplace safety, and the cleanliness of our water, food, and air. Social interactions and relationships also play a crucial role. Health begins in our homes, schools, workplaces, neighborhoods, and communities. Taking care of ourselves involves dedication and making smart lifestyle choices. Access to social and economic opportunities, as well as the resources and support available in our environments, significantly impacts our health, well-being, and quality of life. It’s essential for everyone in the community to have equal opportunities to make choices that promote good health.
Education
Education is a key predictor of lifelong health. Graduating from high school is a significant personal achievement and crucial for an individual’s social and economic progress. Poverty can increase the risk of developing chronic diseases, which may further reduce income. A Healthy People 2030 goal is to increase educational opportunities and support children and adolescents in excelling at school. Higher educational attainment is linked to higher incomes, better employment options, increased social support, and more opportunities for healthier choices—all of which can improve health outcomes and extend life expectancy. Conversely, lower education levels are associated with low health literacy and higher levels of risky behaviors.
From 2022 to 2023, Minnesota and Roseau saw a decline in reading proficiency among third graders. In contrast, Marshall County experienced the largest gain in reading proficiency during this period. Red Lake, Kittson, and Pennington also showed notable improvements in reading proficiency. Regarding math proficiency, Roseau had a slight decline, while Minnesota, Kittson, Marshall, Pennington, and Red Lake all demonstrated positive improvements from 2022 to 2023. Red Lake had the largest increase, followed closely by Kittson. Each county has unique needs, and even small positive improvements are encouraging (Minnesota Early Childhood Longitudinal Data System 2017-2023).
All five Quin counties had higher graduation rates than the state of Minnesota. Kittson, Marshall, and Red Lake counties achieved graduation rates of 90% or more in both 2021 and 2022. Pennington County reached a graduation rate of 92.2% in 2022. Although Roseau County experienced a slight decline from 2021 to 2022, its graduation rate remained relatively high. High graduation rates are crucial because they demonstrate how well the education system prepares students for future success. Completing high school provides more opportunities for higher education and employment, which can lead to greater economic stability and an improved quality of life. Conversely, lower graduation rates indicate areas where additional support and resources may be necessary to help students thrive.
| Location | 2021 | 2022 |
|---|---|---|
| Minnesota | 83.3% | 83.6% |
| Kittson | 93.6% | 95.1% |
| Marshall | 94.4% | 92.5% |
| Pennington | 89.7% | 92.2% |
| Red Lake | 100% | 92.9% |
| Roseau | 86.6% | 85.4% |
The Annie E. Casey Foundation, KIDS COUNT Data Center (2023)
Economic Stability
According to U.S. Department of Health and Human Services, Office of Disease Prevention and Health Promotion (2024), individuals with stable employment tend to be healthier. However, many people face challenges in finding and maintaining jobs. Those with disabilities, injuries, or physical conditions may find it particularly difficult to work. Additionally, even those with steady employment often do not earn enough to afford essential items for maintaining their health. Income influences various aspects of our lives, including our living conditions, the stability of our housing, the quality of our homes, the schools we attend, the recreational activities we engage in, and the types of food we consume.
The unemployment rates between 2022 and 2023 have shown minimal changes. Marshall and Roseau counties experienced increases of 0.4%, Kittson County rose by 0.3%, Red Lake increased by 0.2%, and both Pennington County and Minnesota saw a 0.1% increase (Minnesota Department of Employment and Economic Development 2015-2023). These values indicate a relatively stable job market for the five Quin counties. However, four out of five Quin counties (Marshall 4.2%, Kittson 3.0%, Red Lake 3.9%, and Pennington 3.3%) have higher unemployment rates compared to the state of Minnesota (2.8%) in 2023. This suggests that while the rates over time are more stable, there is still room for improvement.
In 2020, unemployment rates saw a significant rise, likely due to the economic fallout from the COVID-19 pandemic. The pandemic triggered widespread job losses and economic disruptions, resulting in higher unemployment rates across many regions. Since then, the job market has been on a gradual path to recovery, as reflected in the relatively stable rates observed in recent years.
Child Care
High-quality child care is crucial for building thriving communities and supporting children’s growth. It ensures that our most vulnerable children receive a strong start in life while allowing parents and guardians to maintain their employment. Community discussions have identified significant gaps in child care access, availability, and affordability. The Minnesota Department of Employment and Economic Development (DEED) has a detailed report outlining these gaps. For further details, refer to figures 4 and 5 on page 3 and tables 3 and 4 on page 4 in the MN DEED report.
County Profiles (More Information)
DEED provides a detailed analysis of data on population, education, labor force, income and cost of living, industry employment, and commuting patterns. These profiles offer valuable insights into the economic landscape of Quin’s five-county jurisdiction, aiding in effective planning. According to the profiles, the entire region is projected to experience a decline in labor force from 2025 to 2035 (Minnesota Department of Employment and Economic Development 2024).


Transportation and Crashes
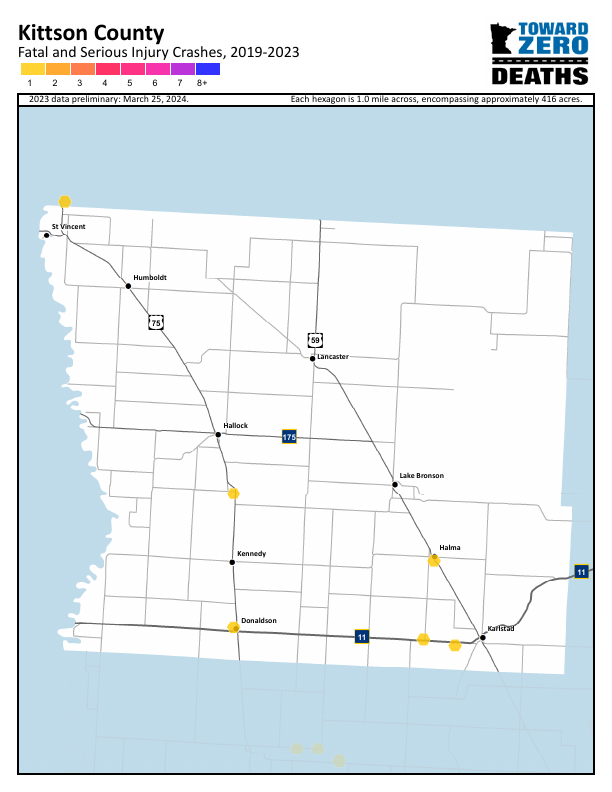
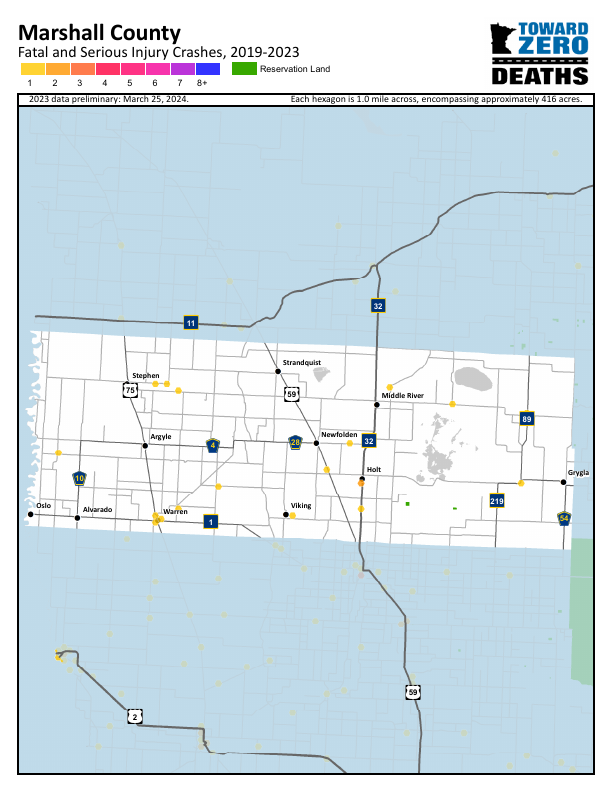
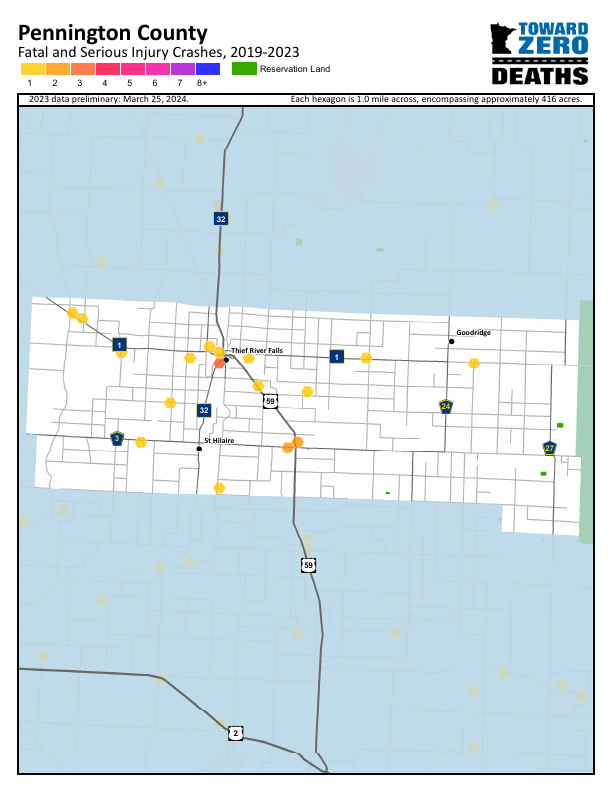
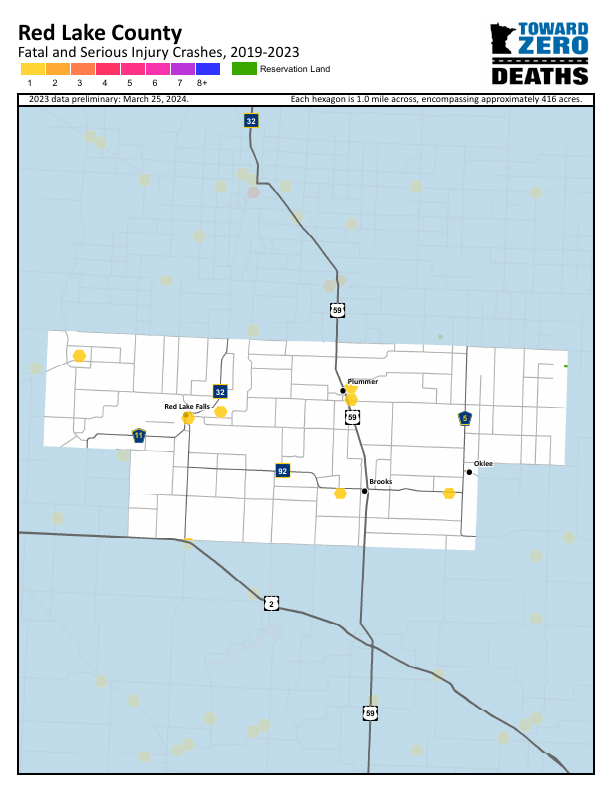
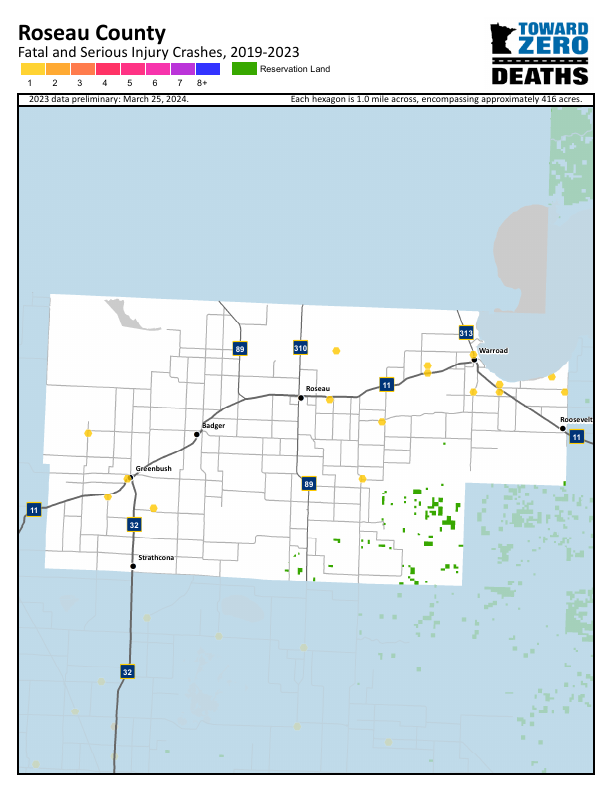
Over a five-year period, none of the five Quin counties showed red, purple, or blue on the maps developed by (Toward Zero Deaths 2023), which is a positive indicator. The absence of these colors suggests that there have been no areas with extremely high crash rates or severe injuries, reflecting effective traffic safety measures and safer roads. Marshall and Pennington counties are the only counties among the five that recorded three deaths or serious injuries (dark orange) within their borders; Pennington County had this occur in multiple locations. Minnesota Toward Zero Deaths (TZD) is the state’s leading traffic safety program, using an interdisciplinary approach to reduce traffic crashes, injuries, and fatalities on Minnesota roads. The Office of Traffic Safety, part of the Minnesota Department of Public Safety, publishes MN Motor Vehicle Crash Facts. Identifying potential high-crash areas in our counties is crucial.
Housing Insecurity
Housing instability is a pressing issue that affects countless individuals and families. It includes a spectrum of challenges such as struggling to pay rent, living in overcrowded conditions, frequent relocations, and the looming threat of eviction. These hardships can deeply impact physical and mental health, educational success, and overall well-being. Tackling housing insecurity is vital for fostering stable, healthy communities and ensuring everyone has a safe, affordable place to call home.
The age-adjusted prevalence of housing insecurity reveals some variations across our counties and the state of Minnesota. In Minnesota, the prevalence is 10.4% (CI: 9.3-11.7%), while the Quin CHS region has a slightly higher rate at 10.6% (CI: 9.3-12.0%). Among the counties, Kittson has a prevalence of 9.4% (CI: 8.3-10.8%), Marshall stands at 10.7% (CI: 9.4-12.2%), Pennington at 11.0% (CI: 9.6-12.4%), Red Lake at 10.5% (CI: 9.2-11.9%), and Roseau at 10.5% (CI: 9.3-11.9%). While these figures show some differences, the overlapping confidence intervals suggest that these variations are not statistically significant. This indicates that housing insecurity rates are relatively similar across the counties and the state of Minnesota.
Food Access
Ensuring access to nutritious food is essential for physical and mental health, academic performance, and overall quality of life. It involves making healthy food available and affordable for everyone, regardless of socioeconomic status. However, many communities face barriers like food deserts, economic constraints, and limited transportation. Addressing these challenges is crucial to promote equity and enable everyone to lead a healthy, fulfilling life. The five Quin counties have statstically similar levels of food insecurity and food stamp usage as the rest of Minnesota.
Healthcare and Dental Access
Access to comprehensive health care, including primary and dental care, is crucial for overall well-being. Primary care providers detect, prevent, and manage health conditions through check-ups, immunizations, chronic disease management, and specialist coordination. Dental services are essential for preventing and treating oral health issues, which affect overall health. Regular check-ups and cleanings prevent cavities and gum disease, while dentists educate on good oral hygiene. Improving access to these services can lead to better health outcomes for our communities. Efforts to increase the availability of primary care providers and dentists, especially in underserved regions, are crucial. This includes initiatives to attract and retain healthcare professionals in rural areas, expanding telehealth services, and ensuring affordable care for all residents. Increasing access to comprehensive, high-quality health care is a Healthy People 2030 Goal.
Population per Primary Care Provider (2022) - Minnesota: 1,133 people per primary care provider.
- Kittson County: Data not available (NA)
- Marshall County: 8,988 people per primary care provider
- Pennington County: 1,252 people per primary care provider
- Red Lake County: Data not available (NA)
- Roseau County: 1,907 people per primary care provider
Pennington County has the closest average to the state of Minnesota, with 1,252 people per primary care provider compared to the state average of 1,133 people per provider. Roseau County has a higher ratio of 1,907 people per provider, indicating less access than the state average. Marshall County has the highest ratio among the counties with available data, with 8,988 people per provider, suggesting significantly less access to primary care services. Data for Kittson and Red Lake counties was not available.
Population per Dentist (2022) - Minnesota: 1,287 people per dentist
- Kittson County: 2,029 people per dentist
- Marshall County: 4,430 people per dentist
- Pennington County: 1,730 people per dentist
- Red Lake County: Data not available (NA)
- Roseau County: 1,699 people per dentist
Roseau County has the closest average to the state of Minnesota, with 1,699 people per dentist compared to the state average of 1,287 people per dentist, indicating relatively good access. Pennington County has a higher ratio of 1,730 people per dentist, indicating less access to dental care and Kittson County shows even less acess to dental care with 2,029 people per dentist. Marshall County has the highest ratio among the counties with available data, with 4,430 people per dentist, suggesting significantly less access to dental services. Data for Red Lake County is not available.
Despite potentially less access to primary care providers, the estimated rate of routine checkups is similar to the Minnesota state average, with about 3 out of 4 people predicted to get their checkups. However, Medicaid beneficiaries show less consistency in receiving dental services. Assessing current performance is difficult due to lagging and fluctuating data.
Years of Potential Lost
Years of potential life lost (YPLL) is a key measure of community health, indicating premature deaths before age 75. Roseau County has a significantly higher YPLL compared to Minnesota, unlike Kittson County, which, despite a higher prevalence, isn’t significantly above the state average. Reducing YPLL and enhancing residents’ quality of life necessitates collaboration among local governments, healthcare providers, and community organizations. By prioritizing preventive measures, early detection, effective treatment of chronic conditions, promoting healthy lifestyles, and addressing social determinants of health, these goals can be achieved easier together.
Adverse Childhood Experiences
Adverse Childhood Experiences (ACEs) are preventable, potentially traumatic events occurring in childhood (0-17 years), such as neglect, witnessing violence, or having a family member attempt or die by suicide. They also include environmental factors that undermine a child’s sense of safety, stability, and bonding, like living with substance abuse, mental health issues, or experiencing parental separation or incarceration. ACEs can increase the risk of chronic stress, adverse coping mechanisms, and lifelong illnesses such as depression, heart disease, obesity, and substance abuse [@cdcAces].
Data on ACEs was obtained from the Minnesota Student Survey Reports (2013-2022) by the Minnesota Department of Education. The survey included questions such as:
- Do you live with anyone who drinks too much alcohol? See Table 5.1.
- Do you live with anyone who is depressed or has any other mental health issues? See Table 5.2.
- Do you live with anyone who uses illegal drugs or abuses prescription drugs? See Table 5.3.
- Does a parent or other adult in your home regularly swear at you, insult you or put you down? See Table 5.4.
- Has a parent or other adult in your home ever hit, beat, kicked or physically hurt you in any way? See Table 5.5.
- Has any relative/family member ever pressured, tricked, or forced you to do something sexual or done something sexual to you? See Table 5.6.
- Has anyone who was not a relative/family member ever pressured, tricked, or forced you to do something sexual or done something sexual to you against your wishes? Table 5.7
- Have your parents or other adults in your home ever slapped, hit, kicked, punched or beat each other up? See Table 5.8.
| Location | Year | 8th Grade | 9th Grade | 11th Grade |
|---|---|---|---|---|
| Kittson County | 2019 | 12.9%* | 0.0% | 7.4%* |
| Kittson County | 2022 | __ | __ | __ |
| Marshall County | 2019 | __ | 12.9%* | __ |
| Marshall County | 2022 | 11.8%* | 19.0%* | 0.0% |
| Pennington County | 2019 | 6.2%* | 13.7% | 12.4%* |
| Pennington County | 2022 | 14.0%* | 16.8% | 16.0% |
| Red Lake County | 2019 | 7.5%* | 14.5%* | 4.7%* |
| Red Lake County | 2022 | 12.9%* | 3.8%* | 7.1%* |
| Roseau County | 2019 | 12.3% | 13.0% | 11.7%* |
| Roseau County | 2022 | 16.7%* | 8.2%* | 12.2%* |
*Count < 16 __ No data available
| Location | Year | 8th Grade | 9th Grade | 11th Grade |
|---|---|---|---|---|
| Kittson County | 2019 | 19.4%* | 20.8%* | 29.6%* |
| Kittson County | 2022 | __ | __ | __ |
| Marshall County | 2019 | __ | 22.6%* | __ |
| Marshall County | 2022 | 21.2%* | 47.6%* | 33.3%* |
| Pennington County | 2019 | 31% | 30.8% | 33.3% |
| Pennington County | 2022 | 35.2% | 36.6% | 42.5% |
| Red Lake County | 2019 | 13.2%* | 18.2%* | 16.7%* |
| Red Lake County | 2022 | 12.9%* | 32.0%* | 14.3%* |
| Roseau County | 2019 | 21.7% | 24.1% | 27.9% |
| Roseau County | 2022 | 23.6% | 26.2% | 33.3% |
*Count < 16 __ No data available
| Location | Year | 8th Grade | 9th Grade | 11th Grade |
|---|---|---|---|---|
| Kittson County | 2019 | 6.5%* | 0.0% | 3.7%* |
| Kittson County | 2022 | __ | __ | __ |
| Marshall County | 2019 | __ | 3.2%* | __ |
| Marshall County | 2022 | 2.9%* | 9.5%* | 4.2%* |
| Pennington County | 2019 | 3.4%* | 8.3%* | 6.7%* |
| Pennington County | 2022 | 3.7%* | 3.1%* | 6.6%* |
| Red Lake County | 2019 | 0.0% | 7.3%* | 4.8%* |
| Red Lake County | 2022 | 3.2% | 3.8%* | 7.1%* |
| Roseau County | 2019 | 5.0%* | 4.1%* | 6.4%* |
| Roseau County | 2022 | 2.8%* | 1.6%* | 10.2%* |
*Count < 16 __ No data available
| Location | Year | 8th Grade | 9th Grade | 11th Grade |
|---|---|---|---|---|
| Kittson County | 2019 | 9.7%* | 4.2%* | 14.8%* |
| Kittson County | 2022 | __ | __ | __ |
| Marshall County | 2019 | __ | 25.8%* | __ |
| Marshall County | 2022 | 23.5%* | 23.8%* | 25.0%* |
| Pennington County | 2019 | 15.8% | 19.5% | 16.2% |
| Pennington County | 2022 | 25.2% | 24.4% | 21.7% |
| Red Lake County | 2019 | 7.5%* | 20.4%* | 11.9%* |
| Red Lake County | 2022 | 12.9%* | 11.5%* | 3.6%* |
| Roseau County | 2019 | 15.6% | 14.5% | 18.8% |
| Roseau County | 2022 | 13.9%* | 23.3%* | 18.4%* |
*Count < 16 __ No data available
| Location | Year | 8th Grade | 9th Grade | 11th Grade |
|---|---|---|---|---|
| Kittson County | 2019 | 9.7%* | 8.7%* | 22.2%* |
| Kittson County | 2022 | __ | __ | __ |
| Marshall County | 2019 | __ | 12.9%* | __ |
| Marshall County | 2022 | 11.8%* | 4.8%* | 8.3%* |
| Pennington County | 2019 | 11.0% | 16.0% | 9.5%* |
| Pennington County | 2022 | 15.7% | 14.5% | 17.9% |
| Red Lake County | 2019 | 13.2%* | 9.1%* | 4.7%* |
| Red Lake County | 2022 | 3.2%* | 0.0% | 10.7%* |
| Roseau County | 2019 | 10.8%* | 15.8% | 9.2%* |
| Roseau County | 2022 | 6.9%* | 13.3%* | 6.3% |
*Count < 16 __ No data available
| Location | Year | 8th Grade | 9th Grade | 11th Grade |
|---|---|---|---|---|
| Kittson County | 2019 | 6.5%* | 4.2%* | 0.0% |
| Kittson County | 2022 | __ | __ | __ |
| Marshall County | 2019 | __ | 6.5%* | __ |
| Marshall County | 2022 | 0.0% | 10.0%* | 8.3%* |
| Pennington County | 2019 | 0.7%* | 3.1%* | 1.9%* |
| Pennington County | 2022 | 6.5%* | 6.9%* | 4.7%* |
| Red Lake County | 2019 | 0.0% | 7.3%* | 0.0% |
| Red Lake County | 2022 | 12.9%* | 3.8%* | 3.6%* |
| Roseau County | 2019 | 3.6%* | 1.4%* | 1.8%* |
| Roseau County | 2022 | 4.2%* | 1.6%* | 8.3% |
*Count < 16 __ No data available
| Location | Year | 8th Grade | 9th Grade | 11th Grade |
|---|---|---|---|---|
| Kittson County | 2019 | 3.2%* | 0.0% | 14.8%* |
| Kittson County | 2022 | __ | __ | __ |
| Marshall County | 2019 | __ | 6.5%* | __ |
| Marshall County | 2022 | 0.0% | 14.3%* | 8.3%* |
| Pennington County | 2019 | 4.1%* | 3.9%* | 6.8%* |
| Pennington County | 2022 | 4.7%* | 4.6%* | 8.4%* |
| Red Lake County | 2019 | 0.0%* | 5.5%* | 4.7%* |
| Red Lake County | 2022 | 3.2%* | 0.0% | 0.0% |
| Roseau County | 2019 | 6.5%* | 4.1%* | 6.6%* |
| Roseau County | 2022 | 6.9%* | 6.6%* | 16.7%* |
*Count < 16 __ No data available
| Location | Year | 8th Grade | 9th Grade | 11th Grade |
|---|---|---|---|---|
| Kittson County | 2019 | 12.9%* | 0.0% | 7.4%* |
| Kittson County | 2022 | __ | __ | __ |
| Marshall County | 2019 | __ | 9.7%* | __ |
| Marshall County | 2022 | 5.9%* | 4.8%* | 4.2%* |
| Pennington County | 2019 | 8.9%* | 10.9%* | 7.6%* |
| Pennington County | 2022 | 11.2%* | 14.5% | 12.3%* |
| Red Lake County | 2019 | 5.8%* | 5.5%* | 2.3%* |
| Red Lake County | 2022 | 9.7%* | 0.0% | 7.1%* |
| Roseau County | 2019 | 7.2%* | 8.8%* | 7.1%* |
| Roseau County | 2022 | 6.9%* | 3.3%* | 6.1%* |
*Count < 16 __ No data available
Social Vulnerability Index (SVI)
Social vulnerability describes the potential adverse effects on communities from external stresses on human health, such as natural or human-made disasters and disease outbreaks. Mitigating social vulnerability can reduce both human suffering and economic losses. The CDC’s Social Vulnerability Index (SVI) organizes fifteen census-derived factors into four themes to measure an area’s social vulnerability. These factors include economic data, education, family characteristics, housing, language proficiency, ethnicity, and vehicle access. The SVI scale ranges from 0 to 1, with 1 representing the highest vulnerability. The Healthy People 2030 initiative focuses on enhancing social and community support. By working together, partners can ideally offer services and resources that help achieve a low vulnerability status.
Kittson County has approximately 690 individuals below poverty line. Among occupied housing units with an annual income of less than $75,000, around 226 are considered cost-burdened, spending more than 30% on their income on housing costs. Additionally, an estimated 118 residents aged 25 and older do not have a high school diploma. Kittson County has about 177 uninsured individuals within the total civilian noninstitutionalized population. There are approximately 1,101 residents aged 65 and older. Lastly, around 26 households have more people than rooms available.
Kittson County Interpretation: Kittson County’s high score in the Housing Type and Transportation category suggests that these are significant areas of concern. Despite the overall low social vulnerability score, the high index in this category highlights the need for targeted interventions to improve housing conditions and transportation access. Addressing these issues can help reduce the overall vulnerability of the community and improve residents’ quality of life.
Marshall County has approximately 1,361 individuals below the poverty line. Among occupied housing units with an annual income of less than $75,000, around 621 are considered cost-burdened, spending more than 30% on their income on housing costs. Additionally, an estimated 467 residents aged 25 and older do not have a high school diploma. Marshall County also has about 365 uninsured individuals within the total civilian noninstitutionalized population. There are approximately 2,003 residents aged 65 and older. Lastly, around 43 households have more people than rooms available.
Marshall County Interpretation: Marshall County has an overall low social vulnerability index, but there are significant concerns regarding household characteristics. The high score in household characteristics indicates that many residents face challenges related to family structure, disability, and single-parent households. Addressing these issues is crucial for improving the overall well-being of the community.
Pennington County approximately has 2,178 individuals below the poverty line. Among occupied housing units with an annual income of less than $75,000, around 1,306 are considered cost-burdened, spending more than 30% on their income on housing costs. Additionally, an estimated456 residents aged 25 and older do not have a high school diploma. Pennington County also has about 436 uninsured individuals within the total civilian noninstitutionalized population. There are approximately 2,581 residents aged 65 and older. Lastly, around 68 households have more people than rooms available.
Pennington County Interpretation: Pennington County has a low to medium overall social vulnerability, with the highest score in the housing type and transportation category. This high score underscores the need for focused interventions in this area. By addressing these specific vulnerabilities, Pennington County can work towards enhancing the well-being and resilience of its residents.
Red Lake County has approximately 670 individuals below the poverty line. Among occupied housing units with an annual income of less than $75,000, around 296 are considered cost-burdened, spending more than 30% on their income on housing costs. Additionally, an estimated136 residents aged 25 and older do not have a high school diploma. Red Lake County also has about 108 uninsured individuals within the total civilian noninstitutionalized population. There are approximately 852 residents aged 65 and older. Lastly, around 33 households have more people than rooms available.
Red Lake County Interpretation: Red Lake County exhibits low overall social vulnerability, with the highest score in the household characteristics category. This indicates a need for targeted interventions in this area. By addressing these specific vulnerabilities, Red Lake County can improve the well-being and resilience of its residents.
Roseau County has approximately 2,365 individuals below the poverty line. Among occupied housing units with an annual income of less than $75,000, around 1,179 are considered cost-burdened, spending more than 30% on their income on housing costs. Additionally, an estimated742 residents aged 25 and older do not have a high school diploma. Roseau County also has about 728uninsured individuals within the total civilian noninstitutionalized population. There are approximately 2,788 residents aged 65 and older. Lastly, around 62 households have more people than rooms available.
Roseau County Interpretation: Roseau County exhibits medium to high overall social vulnerability, with all categories except racial and ethnic minority status falling into the medium to high-risk range. The scores for socioeconomic status, household characteristics, and housing type/transportation highlight areas that could benefit from focused efforts. These aspects emphasize the value of targeted interventions to enhance the well-being and resilience of Roseau County’s residents. By addressing these specific challenges, the county can work towards creating a more supportive and sustainable community.
The SVI project is an excellent starting point for identifying areas to invest in related to socioeconomic factors (Centers for Disease Control and Prevention/ Agency for Toxic Substances and Disease Registry/ Geospatial Research, Analysis, and Services Program 2022). However, it is not the only area we explored.