Health Status
Health status is a comprehensive measure of the overall well-being of a community, encompassing various indicators that reflect the physical and mental health of its residents. Key factors in assessing health status include the rate of natural increase, prescription rates, child and teen checkups, prenatal care, and child immunizations.
The rate of natural increase provides insight into population growth and demographic trends, which can influence healthcare needs and resource allocation. Prescription rates can indicate the prevalence of chronic conditions and the community’s access to necessary medications. Regular child and teen checkups are essential for early detection and prevention of health issues, ensuring that young individuals receive the care they need to thrive.
Prenatal care is crucial for the health of both mothers and babies, reducing the risk of complications during pregnancy and childbirth. Child immunizations are vital for preventing the spread of infectious diseases and protecting public health. By monitoring these indicators, we can better understand the health challenges facing our community and develop targeted interventions to improve health outcomes for all residents.
General, Physical and Mental Distress
Understanding the general, physical, and mental health status of a community is essential for identifying health needs and implementing effective interventions. This section provides an overview of the health status in Minnesota, with a focus on Polk, Norman, and Mahnomen counties. The data includes age-adjusted and crude prevalence rates for general health, physical health, and mental health, sourced from the CDC Places project. Mahnomen County has the highest prevalence in all three categories general, physical, and mental distress. Polk County and Norman County are similar to the state of Minnesota. About 1 in every 7 residents of Polk County or Norman County has poor or fair health while about 1 in every 4 Mahnomen residents have poor or fair health.
Rate of Natural Increase
The birth rate and death rate are fundamental demographic indicators that provide insights into the population dynamics of a region. The birth rate measures the number of live births per 1,000 people in a given year, while the death rate measures the number of deaths per 1,000 people in the same period. The difference between these two rates is known as the natural increase (or decrease, if deaths exceed births), which indicates the growth or decline of a population excluding migration.
Natural increase is a crucial component of population change, but it does not account for the movement of people into or out of a region. Migration can significantly impact population size and composition, often overshadowing natural increase. For instance, a region with a high birth rate and low death rate might still experience population decline if a large number of people move away. Conversely, areas with low natural increase might grow rapidly due to high levels of immigration.
In 2020, Polk County, Norman County, and Mahnomen County all experienced a natural decrease, likely due to the impact of COVID-19. The pandemic has significantly influenced both birth and death rates, with increased mortality and potential delays in births due to economic and health uncertainties.
Among these counties, Mahnomen consistently has the highest birth rate, reflecting a younger population or higher fertility rates. In contrast, Norman County has the highest death rate, which could be attributed to an older population or other health factors.
Over the years, Mahnomen County has generally maintained a positive natural increase, while Polk and Norman Counties have struggled with higher death rates (Minnesota Department of Health 2015-2020). These trends highlight the need for targeted public health interventions and policies to support population growth and health in these regions.
Looking ahead, it will be important to monitor these trends and implement measures to mitigate the long-term impacts of the pandemic. Public health initiatives, economic support, and healthcare improvements could help stabilize and improve the natural increase rates in these counties.
| Birth Rate | Death Rate | Natural Increase | Year |
|---|---|---|---|
| 13.2 | 11.4 | 1.8 | 2015 |
| 14.2 | 11.4 | 2.8 | 2016 |
| 13.7 | 10.8 | 2.9 | 2017 |
| 13.8 | 11.6 | 2.2 | 2018 |
| 11.7 | 11.8 | -0.1 | 2019 |
| 12.1 | 13.7 | -1.6 | 2020 |
| Birth Rate | Death Rate | Natural Increase | Year |
|---|---|---|---|
| 11.1 | 15.6 | -4.5 | 2015 |
| 11.2 | 15.6 | -4.4 | 2016 |
| 12.6 | 17.4 | -4.8 | 2017 |
| 12.5 | 16.1 | -3.6 | 2018 |
| 10.8 | 13.8 | -3 | 2019 |
| 9.5 | 12.3 | -2.8 | 2020 |
| Birth Rate | Death Rate | Natural Increase | Year |
|---|---|---|---|
| 17.2 | 11.2 | 6 | 2015 |
| 20.9 | 11.2 | 9.7 | 2016 |
| 17.7 | 14.3 | 3.4 | 2017 |
| 16.3 | 12.7 | 3.6 | 2018 |
| 17.7 | 11.9 | 5.8 | 2019 |
| 14.3 | 14.4 | -0.1 | 2020 |
Prescription Rate
Polk, Norman, and Mahnmoen did not experience a big change from 2022 to 2023 in prescription rates per 1,000 residents(Minnesota Board of Pharmacy 2022-2023). Prescription rates enable us to compare how our counties measure up against each other. Out of the three counties, Mahnomen has the highest prescription rate per 1,000 residents.
Child and Teen Checkup Outreach
PNM CHS provides outreach for the preventive healthcare program Child and Teen Checkups. Child and Teen Checkups include well-child medical exams and dental care, at no cost to eligible children and teens. These checkups include specific screening components to improve the health of children and teens, and limit long-term outcomes of undetected health problems. Children and teens, birth through age 20 years, and enrolled in Medical Assistance (MA) are eligible to participate.
Prenatal Care
Prenatal care is essential for ensuring the health and well-being of both mothers and their babies. Adequate prenatal care helps monitor the progress of the pregnancy, identify and manage potential health issues, and provide important health education to expectant mothers.
In Minnesota, the percentage of mothers receiving late or inadequate prenatal care increased slightly from 8.7% in 2021 to 9.4% in 2022, representing a 0.7% increase. Data for Polk County and Norman County is not available for both years, likely due to suppression rules or the majority of births occurring out of state, possibly in North Dakota. Mahnomen County had a high rate of late or inadequate prenatal care at 29.9% in 2021, but data for 2022 is not available (The Annie E. Casey Foundation, KIDS COUNT Data Center 2024). The Minnesota Department of Health is currently developing a new dashboard that should help address the data suppression limitations identified in the Kids Count data. Please check back in Q2 of 2025 for the most up-to-date information.
Prenatal care is essential for ensuring the health and well-being of both mothers and their babies. Adequate prenatal care helps to monitor the progress of the pregnancy, identify and manage potential health issues, and provide important health education to expectant mothers.
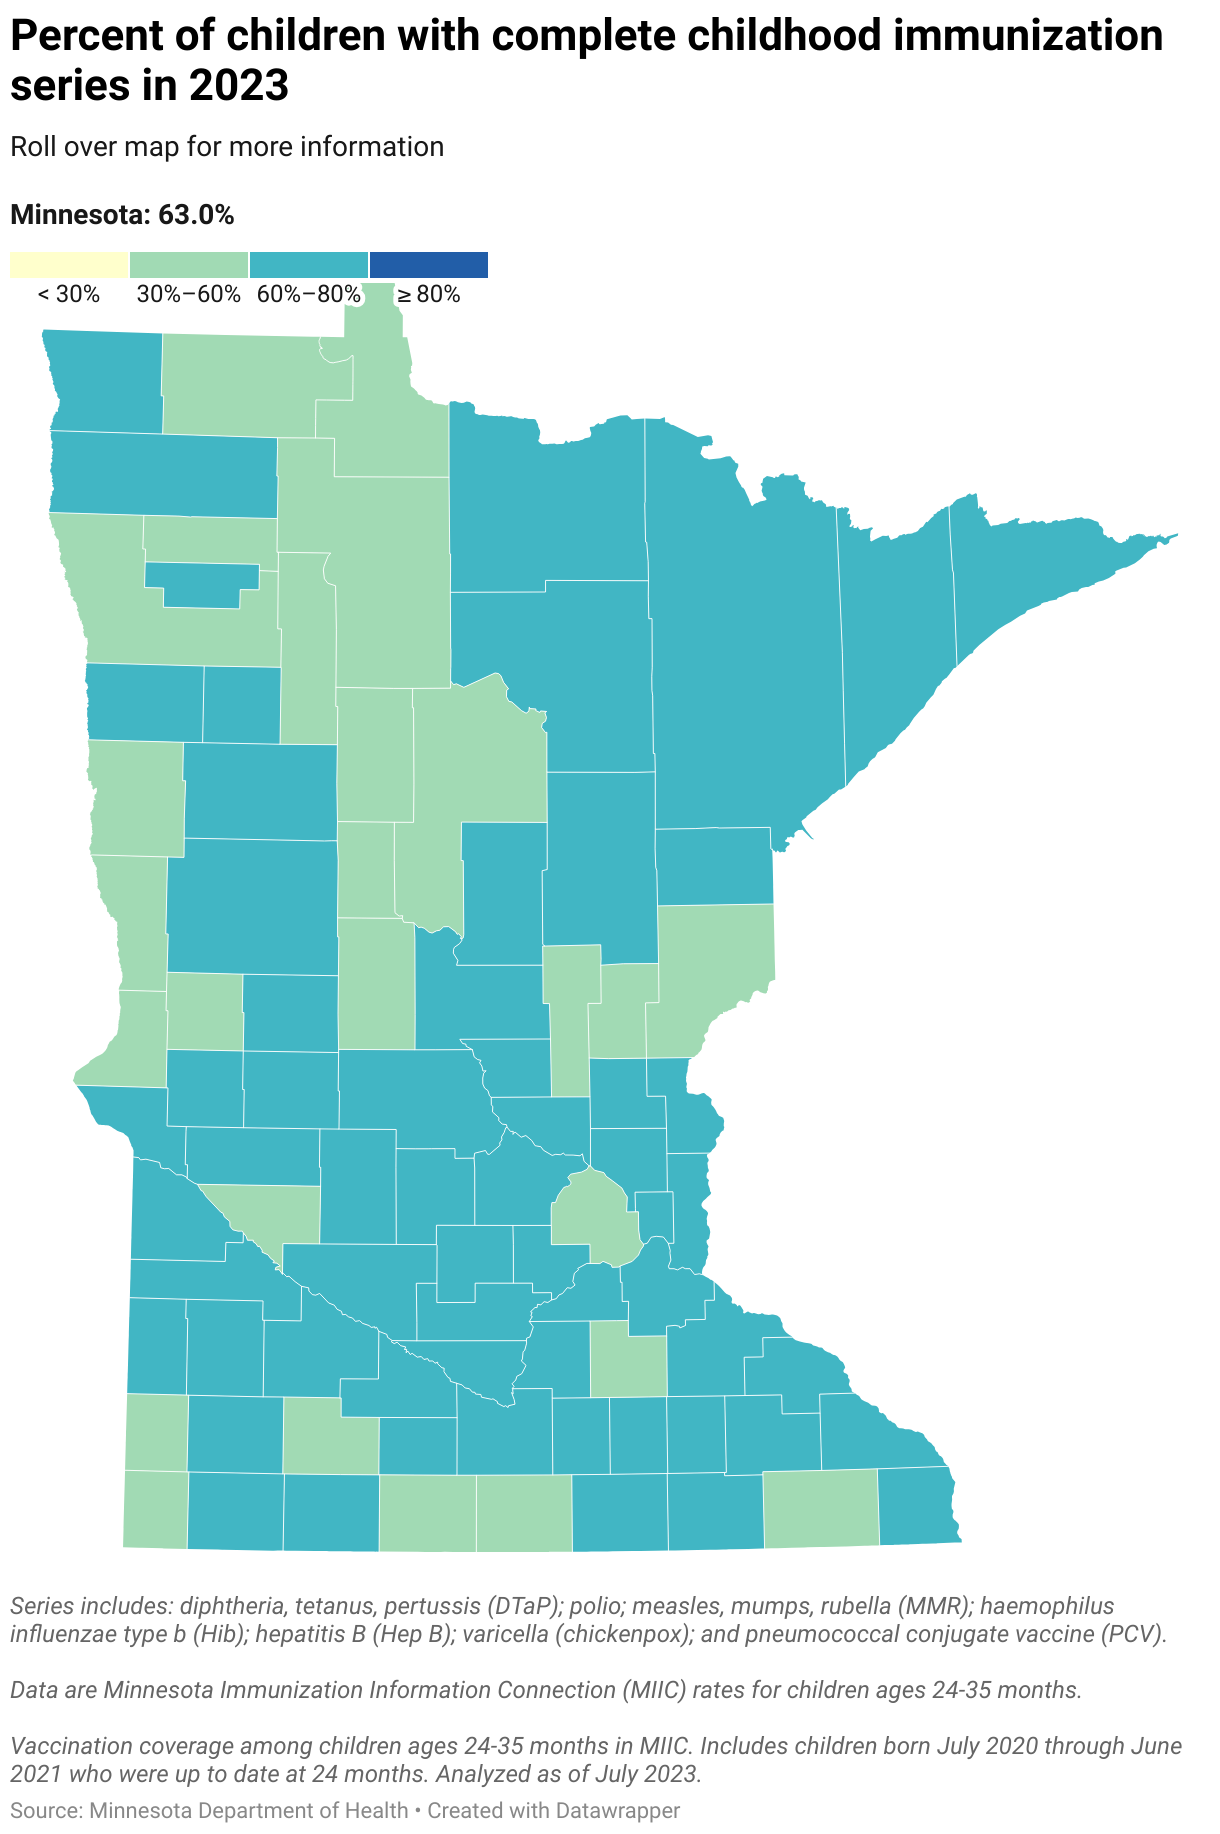
Childhood Immunizations
According to Minnesota Department of Health, childhood and adolescent vaccination rates decreased during the COVID-19 pandemic. Healthy People (HP) 2030 Goal is to increase vaccination rates. Infants and children need to get vaccinated to prevent diseases like hepatitis, measles, and pertussis. Teaching people about the importance of vaccines, sending vaccination reminders, and making it easier to get vaccines can help increase vaccination rates in children, adolescents, and adults. The following map and the next plot/table use the same data but just display it differently.
Minnesota, Norman County, and Mahnomen County all experienced declines in vaccination rates for the seven vaccine series, DTaP, Hep A, Hep B, Hib, MMR, PCV, Polio, Rotovirus, and Varicella. Polk County improved their vaccination rate for Varicella, Rotovirus, Polio, MMR, Hep B, DTaP, and the seven vaccine series.